Fig. 9
Download original image
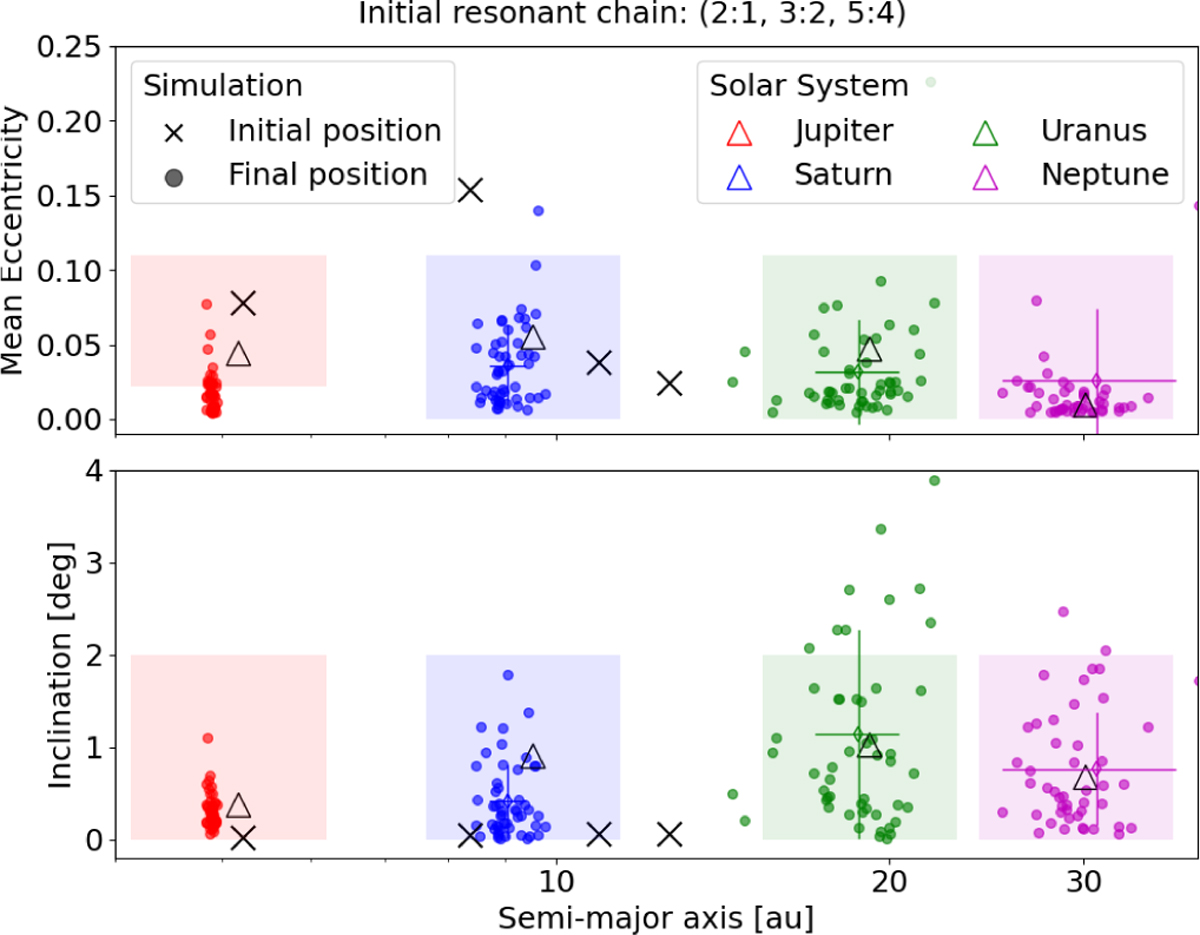
Results of the N-body integrations of 200 simulations starting from the chain (2:1, 3:2, 5:4) (simulation C4 in Sec. 2) with a disc of 50 M⊕. The figure shows the mean eccentricities (top panel) and inclinations (bottom panel) of the planets with respect to their semimajor axes. The initial positions of the planets are given by the black crosses and their positions after integration are shown by the coloured dots. The coloured bars give the mean and standard deviation of the distribution of orbital parameters for each planet. Only the simulations passing criterion A are shown in the figure (here 25.5%). The coloured boxes represent criteria B and C* (see text for more details). For reference, the current positions of the Solar System planets are given by the triangles.
Current usage metrics show cumulative count of Article Views (full-text article views including HTML views, PDF and ePub downloads, according to the available data) and Abstracts Views on Vision4Press platform.
Data correspond to usage on the plateform after 2015. The current usage metrics is available 48-96 hours after online publication and is updated daily on week days.
Initial download of the metrics may take a while.