Fig. 7
Download original image
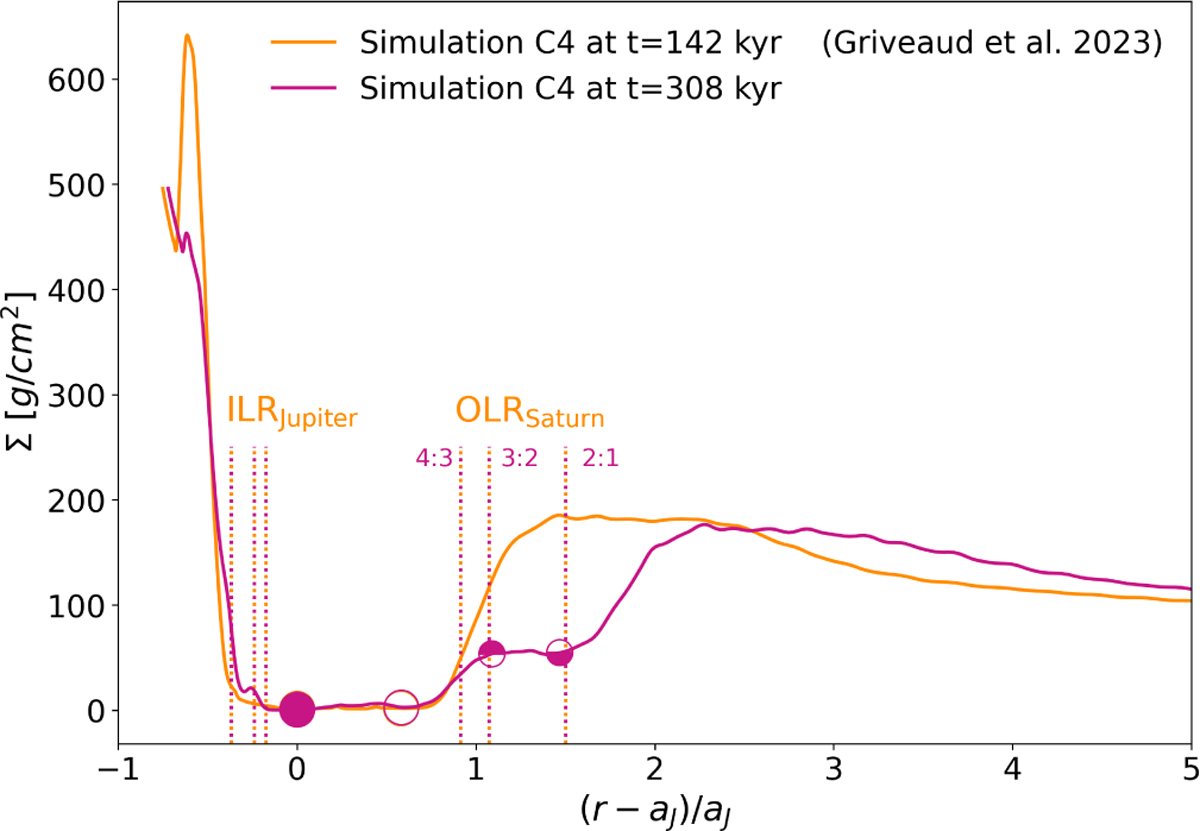
Radial profiles of the surface density in simulation C4 rescaled around Jupiter’s position. The teal line corresponds to a time when only Jupiter and Saturn are in the disc (essentially the simulation from Griveaud et al. 2023). At that time, t = 142 kyr, the pair of planets is migrating slowly inwards, as seen in Fig. 5. The magenta line shows the profile when the four giant planets are migrating outwards at t = 308 kyr. The planet positons are given by the circle markers. The vertical dotted lines indicate the positions of the inner Lindblad resonances (ILR) of Jupiter and the outer Lindblad resonance (OLR) of Saturn (see text for more details).
Current usage metrics show cumulative count of Article Views (full-text article views including HTML views, PDF and ePub downloads, according to the available data) and Abstracts Views on Vision4Press platform.
Data correspond to usage on the plateform after 2015. The current usage metrics is available 48-96 hours after online publication and is updated daily on week days.
Initial download of the metrics may take a while.