Fig. 8
Download original image
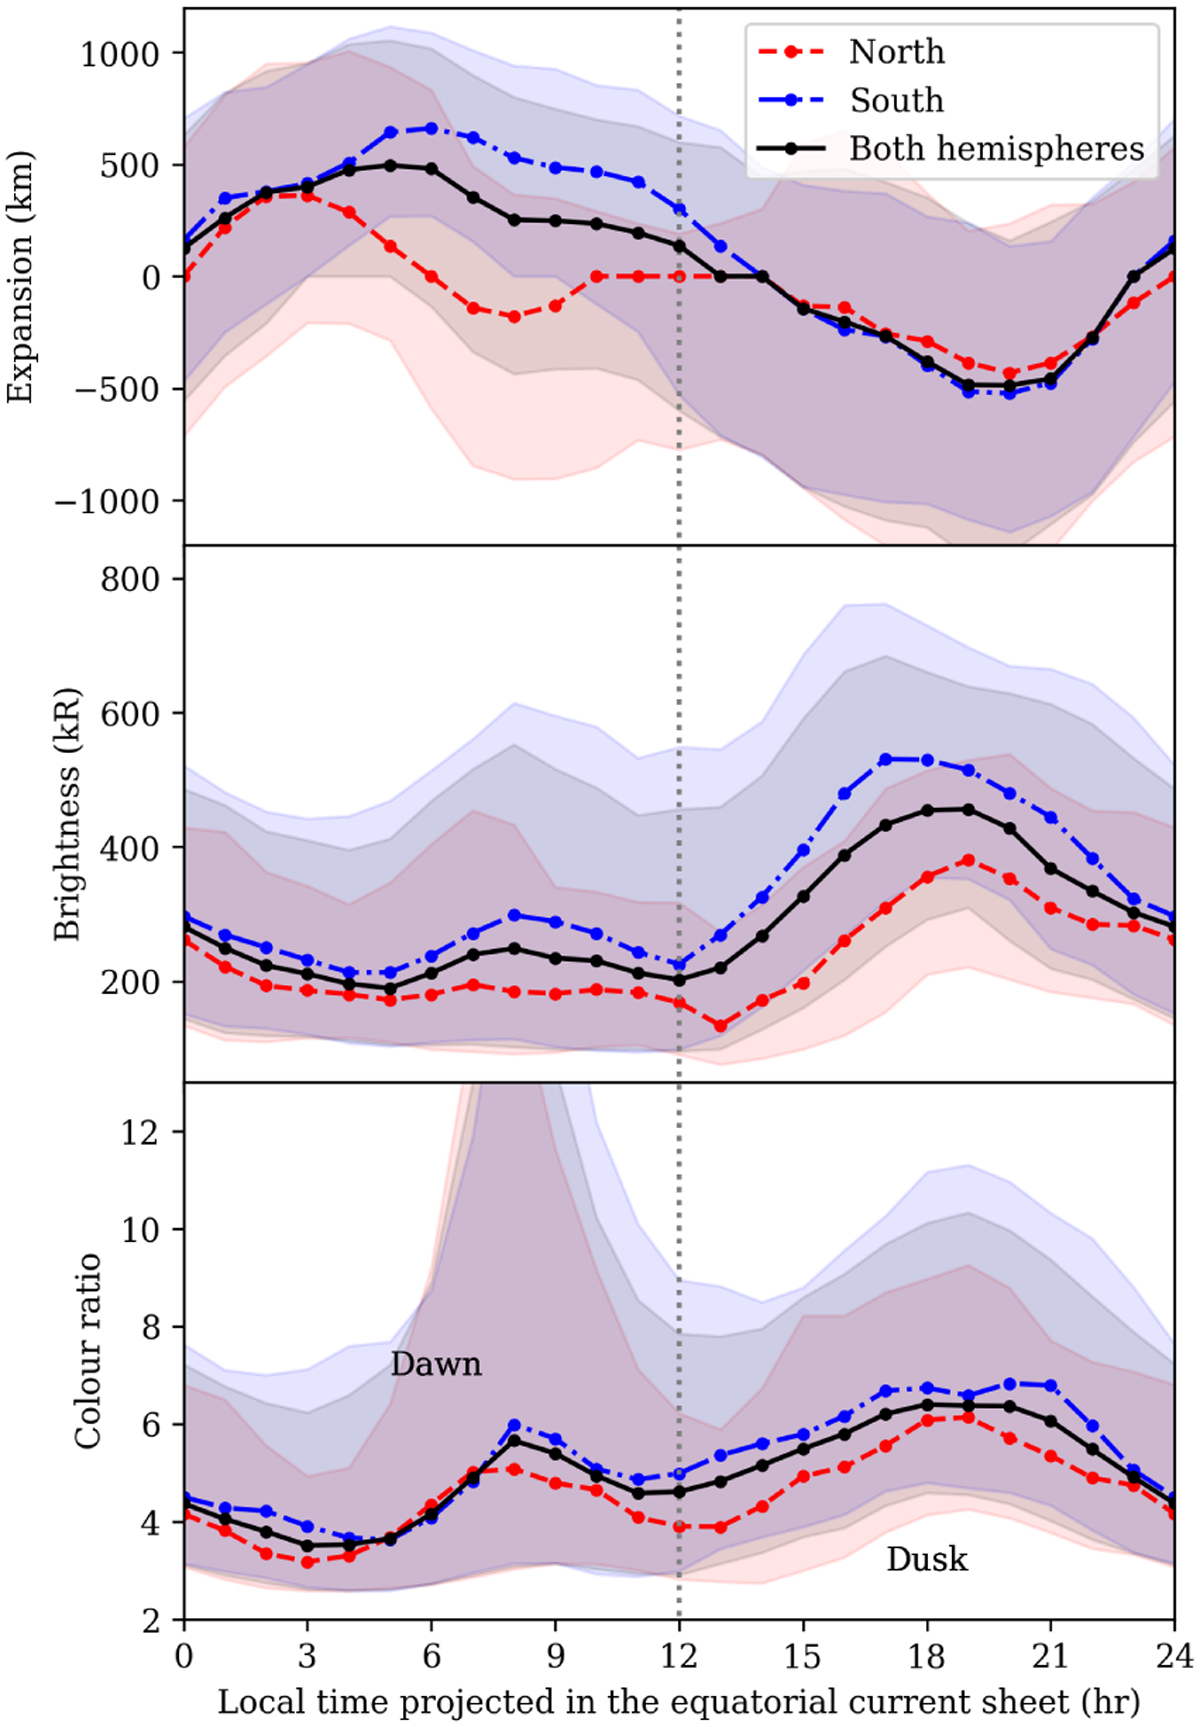
Median-averaged expansion, characteristic brightness, and colour ratio of the ME as a function of projected local time in the ECS. The northern hemisphere is given by a red dashed line, the southern hemisphere by a blue dot-dashed line, and both hemispheres by a solid black line. The interval spanned by the 25th-to-75th percentile range has been shaded for each series.
Current usage metrics show cumulative count of Article Views (full-text article views including HTML views, PDF and ePub downloads, according to the available data) and Abstracts Views on Vision4Press platform.
Data correspond to usage on the plateform after 2015. The current usage metrics is available 48-96 hours after online publication and is updated daily on week days.
Initial download of the metrics may take a while.