Open Access
Fig. 2
Download original image
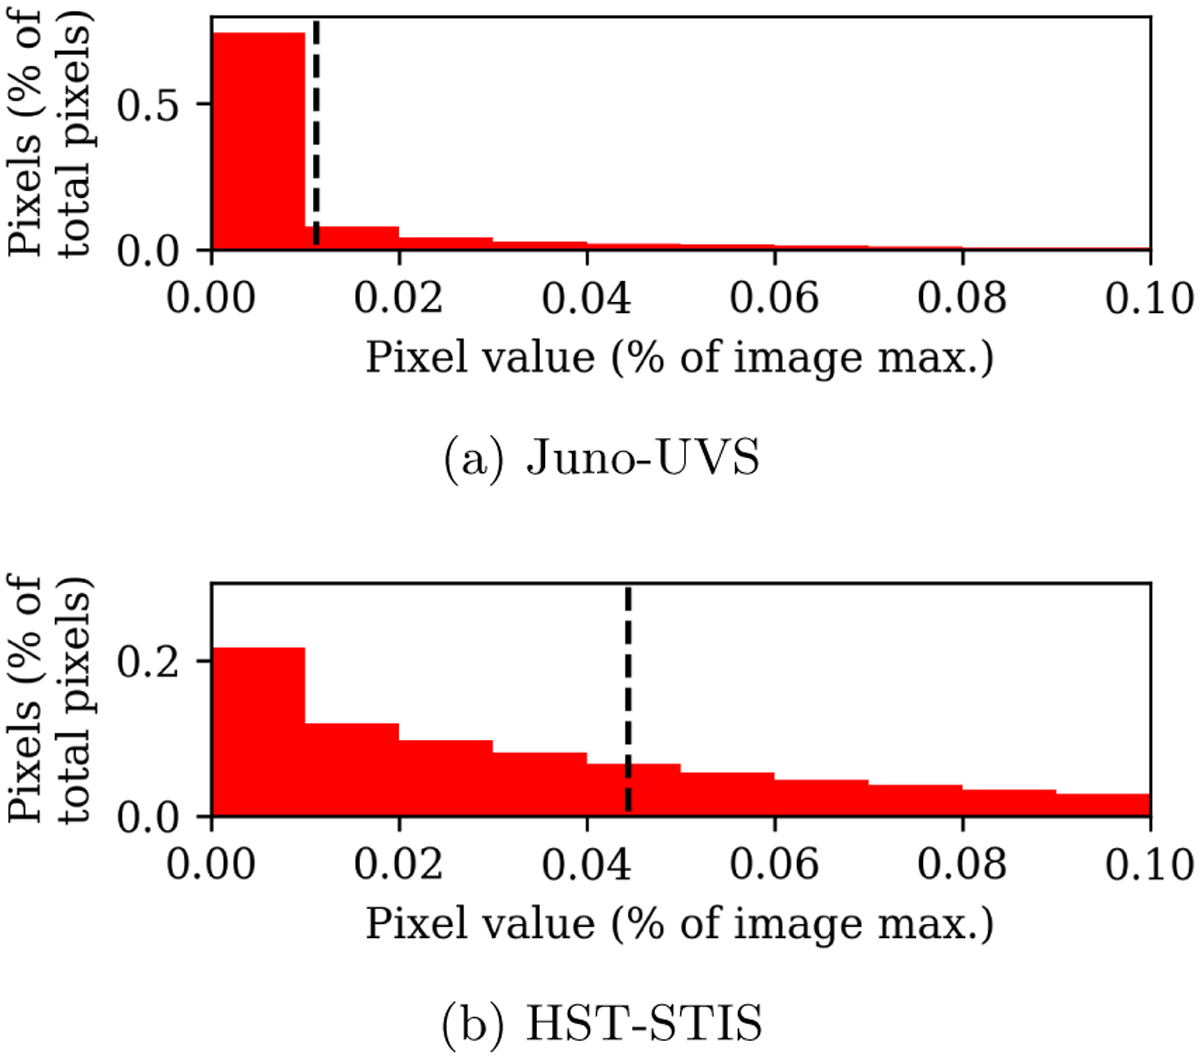
Histograms of the average pixel-brightness distributions for the (a) UVS and (b) STIS images used in this work. The position of the 75th (UVS) or 50th (HST) percentile cut-off has been annotated with a dashed black line. The plot has been truncated at a percentage pixel value of 0.1 to highlight the position of the cut-off.
Current usage metrics show cumulative count of Article Views (full-text article views including HTML views, PDF and ePub downloads, according to the available data) and Abstracts Views on Vision4Press platform.
Data correspond to usage on the plateform after 2015. The current usage metrics is available 48-96 hours after online publication and is updated daily on week days.
Initial download of the metrics may take a while.