Fig. 4
Download original image
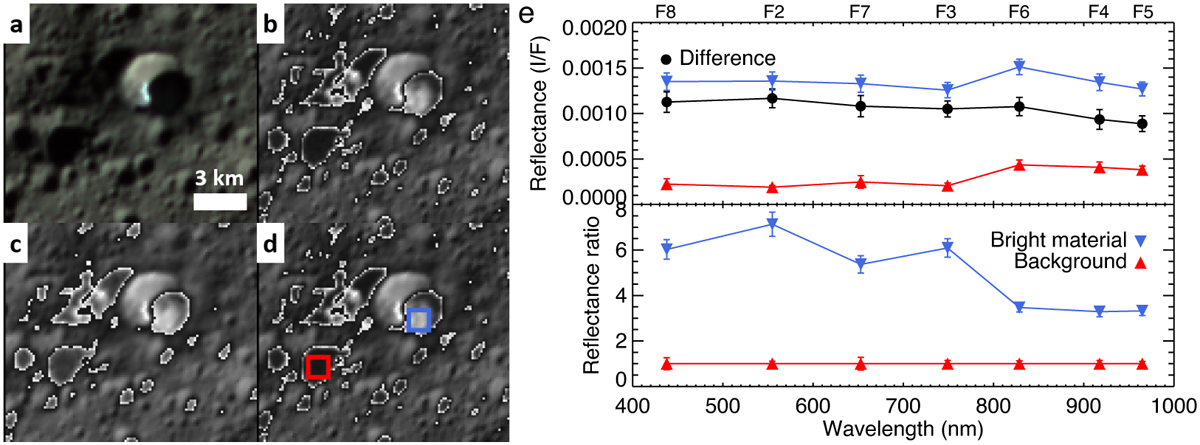
Shadowed bright deposit NP05 in the Zatik crater. (a) Color composite with (R, G, B) = (F5, F2, F8). (b) F2 image (low compression ratio) with the contrast enhanced in shadowed areas, revealing the bright deposit. (c) F6 image (high compression ratio) with the contrast enhanced in shadowed areas. (d) F2 image in b with the sampled areas outlined. Outline colors correspond to the curves in e. (e) Spectra associated with the areas indicated in d. Top: bright material spectra, background spectra, and their difference. Bottom: bright material and background spectra divided by the background spectrum. The projections in a–d show the area bounded by latitudes (69.0°, 70.5°) and longitudes (111.0°, 116.0°)E.
Current usage metrics show cumulative count of Article Views (full-text article views including HTML views, PDF and ePub downloads, according to the available data) and Abstracts Views on Vision4Press platform.
Data correspond to usage on the plateform after 2015. The current usage metrics is available 48-96 hours after online publication and is updated daily on week days.
Initial download of the metrics may take a while.