Fig. 2
Download original image
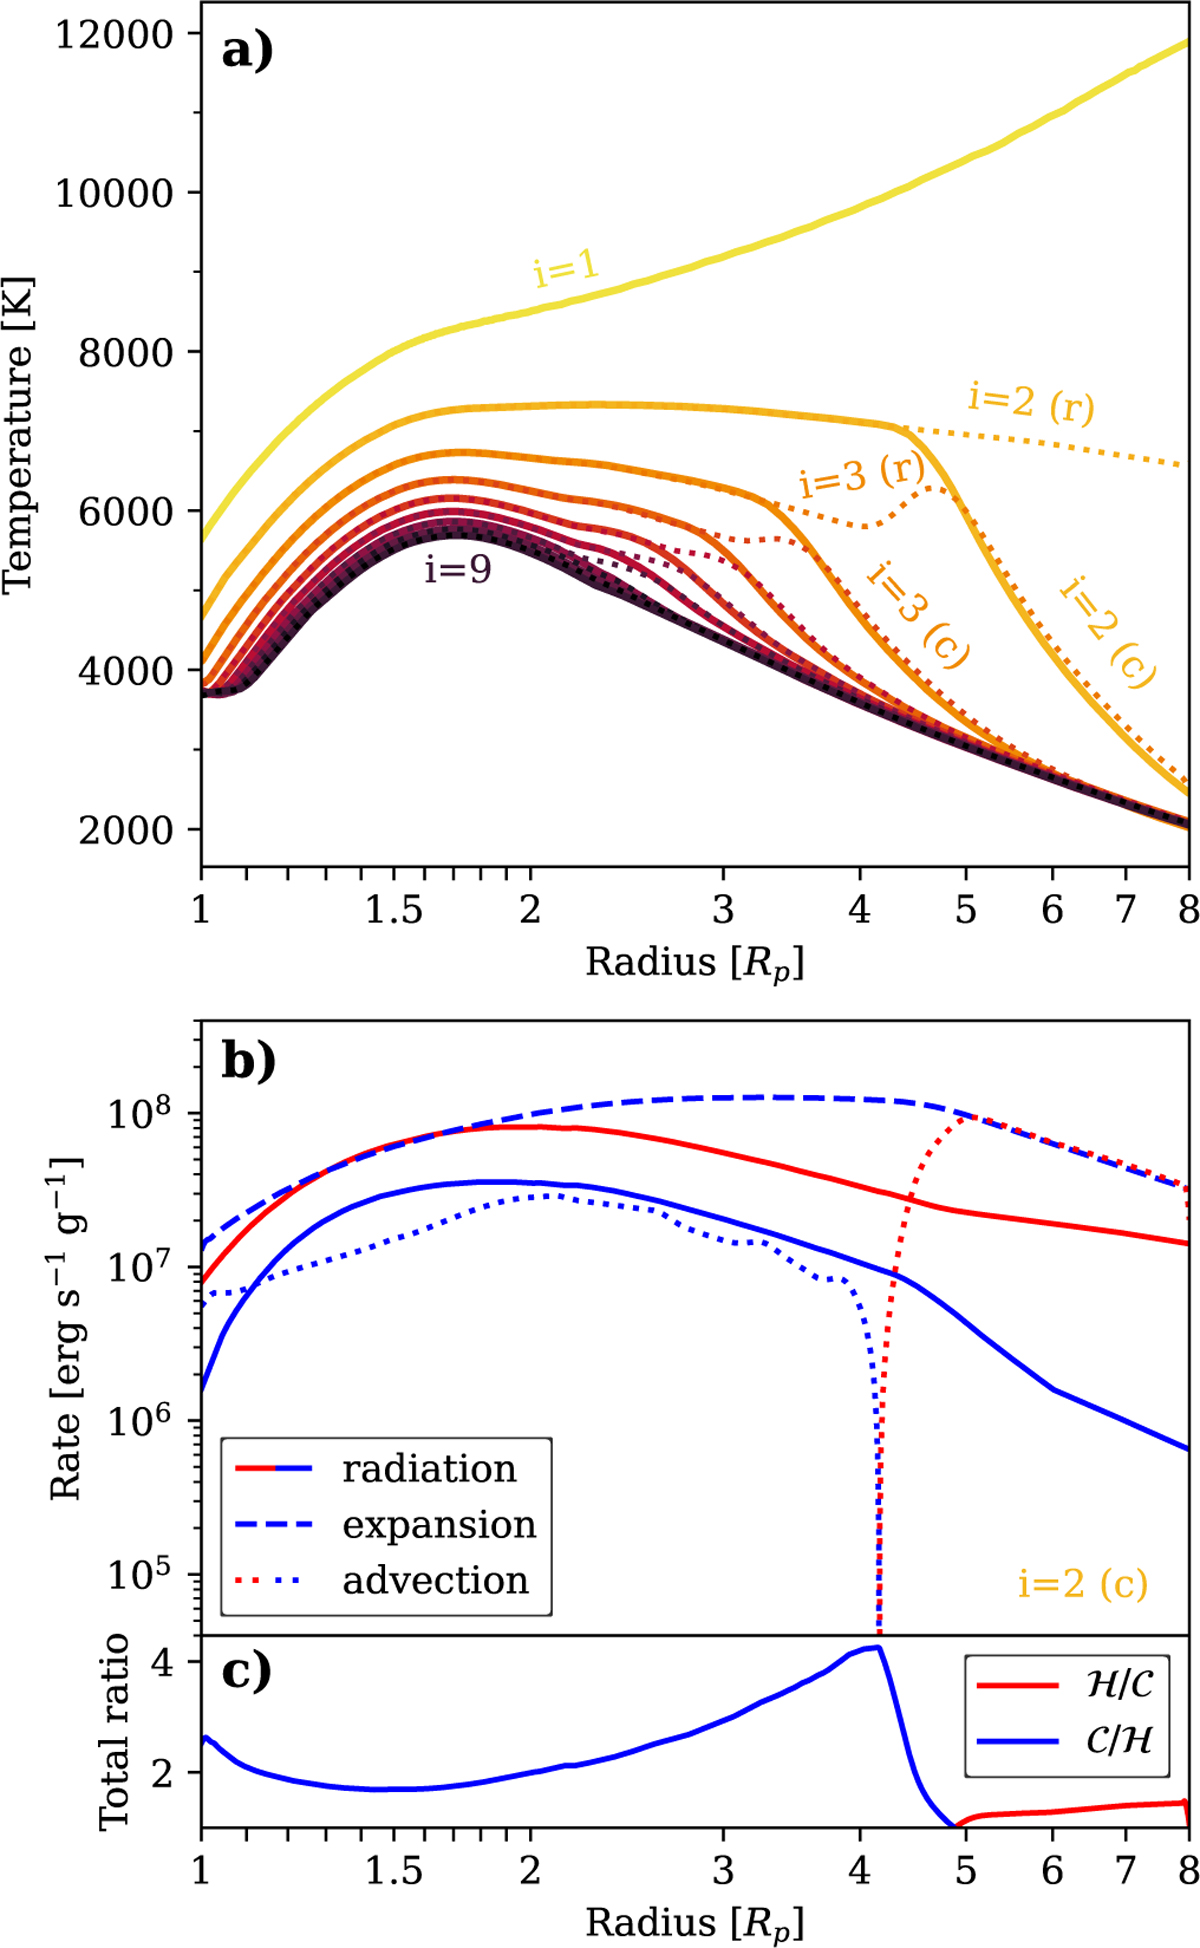
Iterative method to solve for the nonisothermal temperature profile. a) Temperature profiles of the different iterations i. Convergence is reached after nine iterations. Upon each iteration, two algorithms are applied to guess the temperature profile. Dotted lines show the profile based on the relax algorithm of Sect. 2.2.1 and are labeled (r). Solid lines then show the profile after the construct algorithm of Sect. 2.2.2 has also been applied and are labeled (c). b) The different heating and cooling rates corresponding to the temperature profile of the second iteration. c) Ratio of the total heating rate to total cooling rate, for the rates shown in panel b. If the ratio is < fc = 1.1 everywhere, the temperature profile is considered converged. Based on the ![]() /C and C/
/C and C/![]() ratios shown here, the guessed i = 3 (r) profile will be cooler at r < 5 Rp and slightly hotter at r > 5 Rp, as confirmed in panel a.
ratios shown here, the guessed i = 3 (r) profile will be cooler at r < 5 Rp and slightly hotter at r > 5 Rp, as confirmed in panel a.
Current usage metrics show cumulative count of Article Views (full-text article views including HTML views, PDF and ePub downloads, according to the available data) and Abstracts Views on Vision4Press platform.
Data correspond to usage on the plateform after 2015. The current usage metrics is available 48-96 hours after online publication and is updated daily on week days.
Initial download of the metrics may take a while.