Open Access
Fig. 8
Download original image
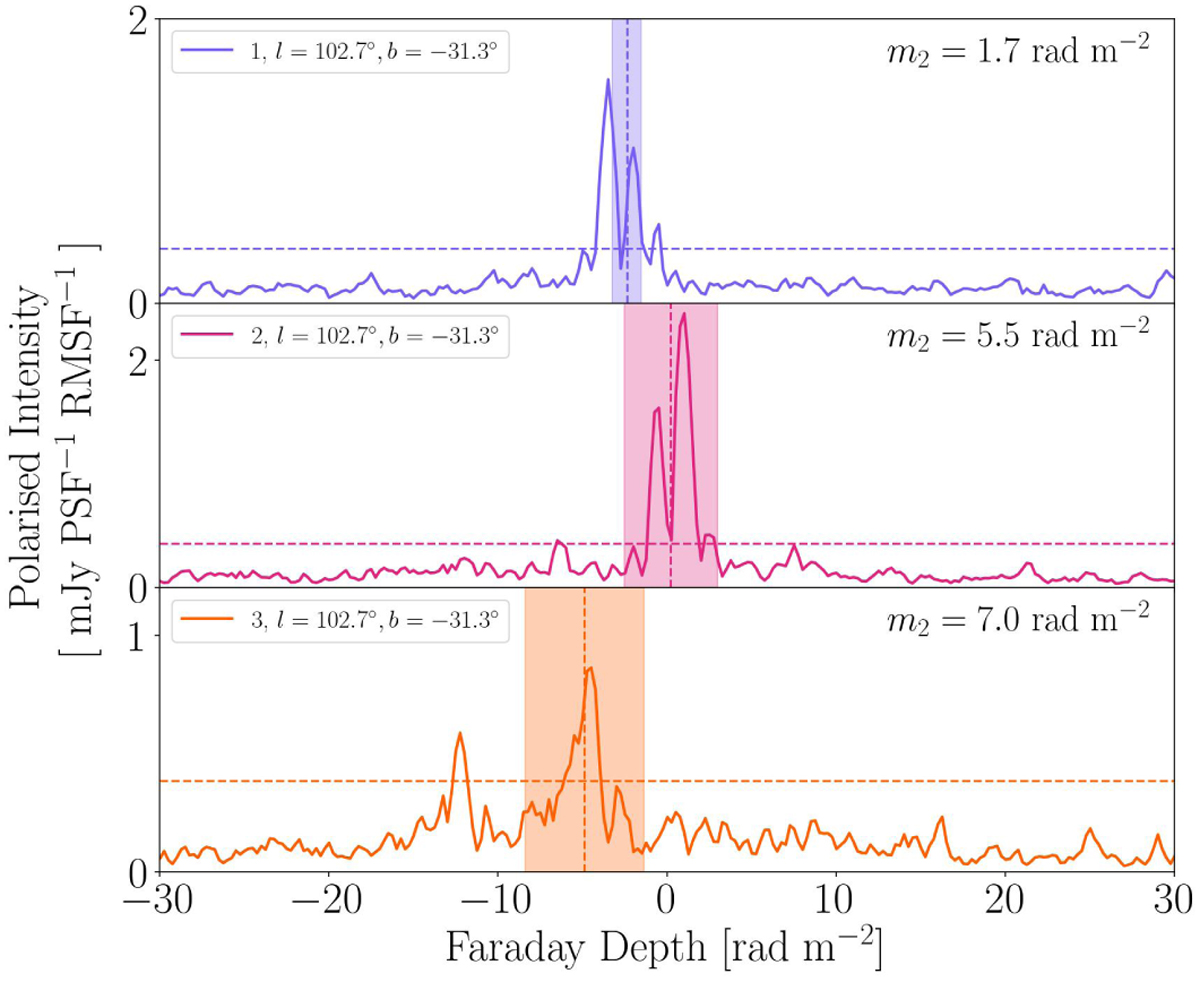
Example Faraday spectra. Vertical dashed line marks M1 and the width of the shaded area corresponds to m2. Horizontal dashed line marks the threshold used to calculate the moments. The locations from which the spectra were extracted are marked in Fig. 7.
Current usage metrics show cumulative count of Article Views (full-text article views including HTML views, PDF and ePub downloads, according to the available data) and Abstracts Views on Vision4Press platform.
Data correspond to usage on the plateform after 2015. The current usage metrics is available 48-96 hours after online publication and is updated daily on week days.
Initial download of the metrics may take a while.