Fig. 3
Download original image
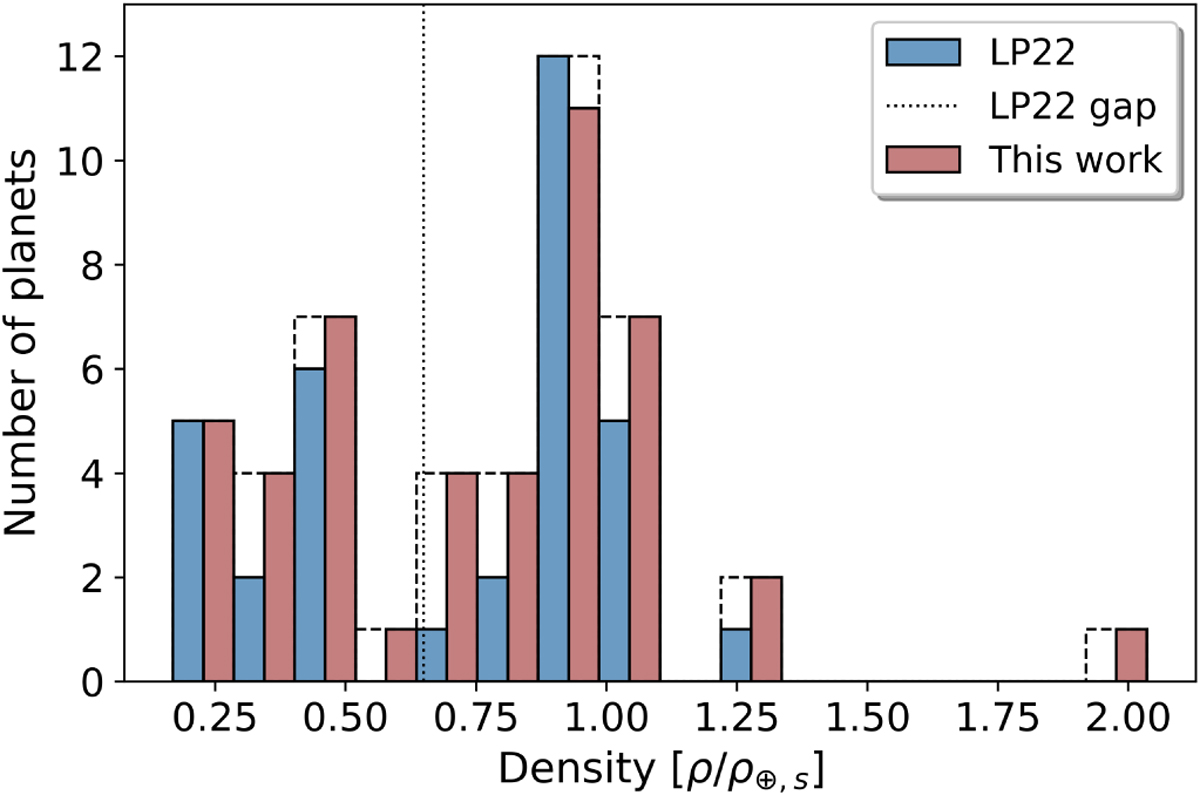
Histogram of the normalized density distribution of small planets orbiting M-dwarfs. In blue, for the LP22 sample. In pink, for this study. For reasons of clarity, the bins are separated in two with the two colors representative of the two samples. A dotted line is drawn at 0.65 ρ⊕,s to represent the compositional gap suggested by LP22.
Current usage metrics show cumulative count of Article Views (full-text article views including HTML views, PDF and ePub downloads, according to the available data) and Abstracts Views on Vision4Press platform.
Data correspond to usage on the plateform after 2015. The current usage metrics is available 48-96 hours after online publication and is updated daily on week days.
Initial download of the metrics may take a while.