Open Access
Fig. C.2
Download original image
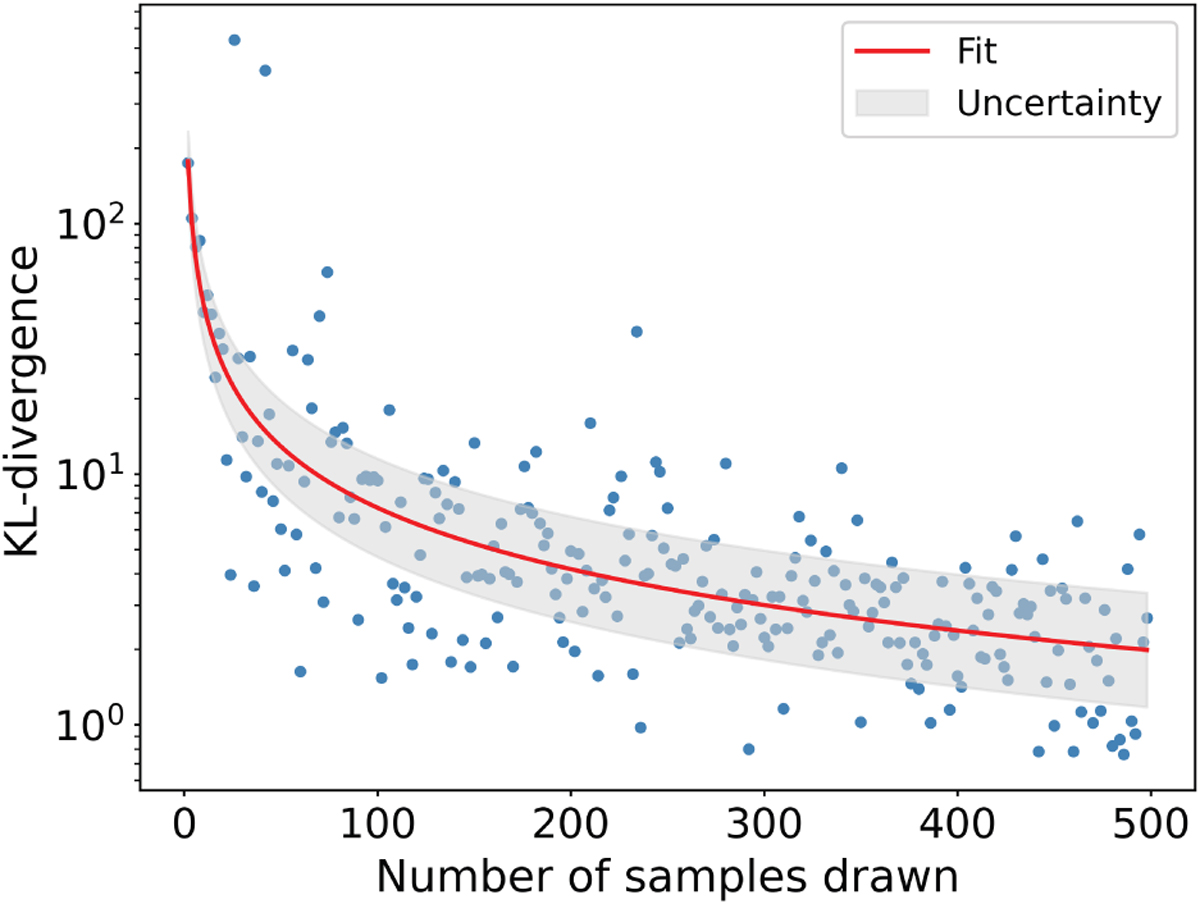
K-L divergence as a function of the number of samples drawn from the Gaussian distribution. The K-L divergence is calculated between this latter and the KDE calculated from the drawn samples. The red line correspond to the fit by the power law and the gray filled area the uncertainty of the fit.
Current usage metrics show cumulative count of Article Views (full-text article views including HTML views, PDF and ePub downloads, according to the available data) and Abstracts Views on Vision4Press platform.
Data correspond to usage on the plateform after 2015. The current usage metrics is available 48-96 hours after online publication and is updated daily on week days.
Initial download of the metrics may take a while.