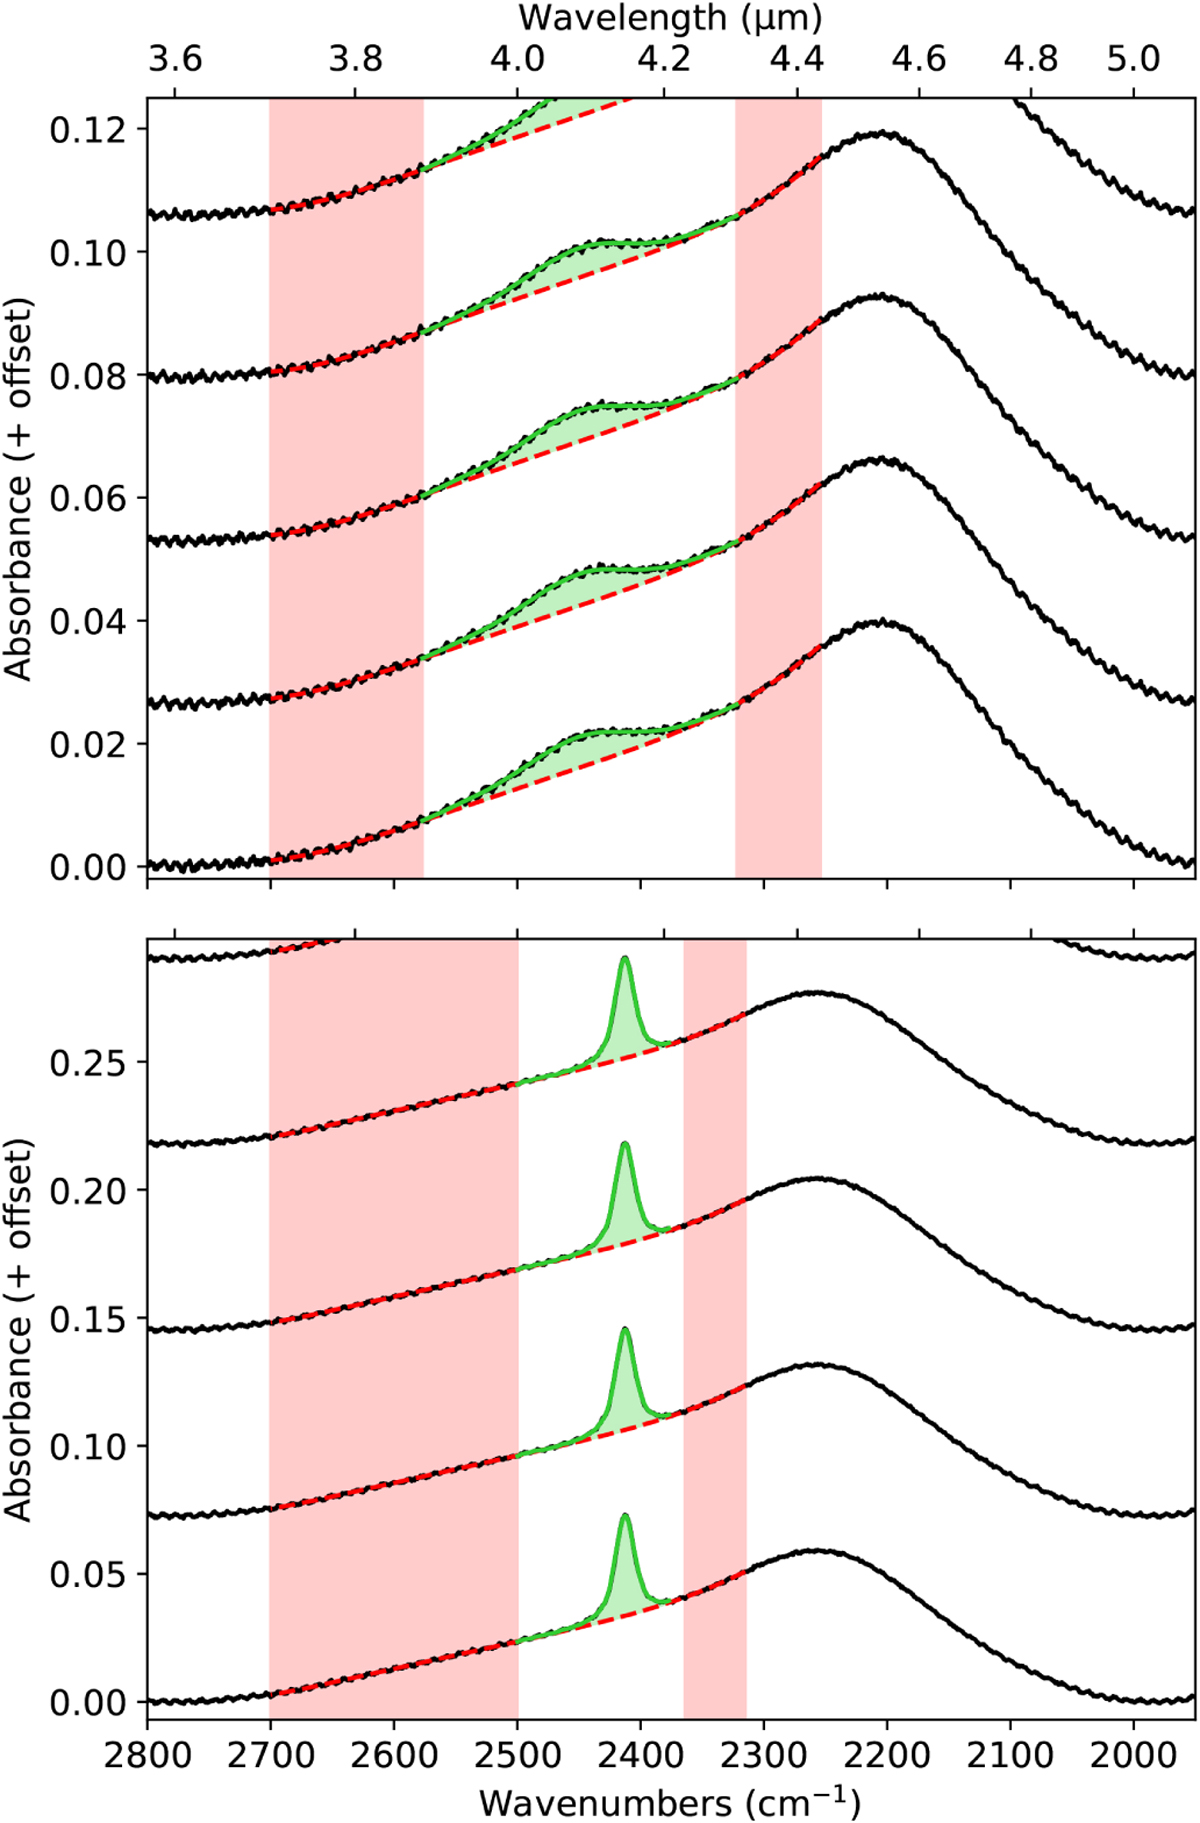
Fig. A.1
Download original image
Example extractions of the profile of the 4.1 µm HDO O-D stretching mode from the H2O combination mode in 0.4% HDO:H2O laboratory spectra (top: amorphous; bottom: crystalline). The laboratory data (already baseline corrected) is plotted in black, the local continuum is plotted in dashed red, and the smoothed and extracted profile is plotted in green. The red shading indicates the wavelengths used to define the local continuum, and the green shading indicates the integrated area used to derive the apparent band strengths.
Current usage metrics show cumulative count of Article Views (full-text article views including HTML views, PDF and ePub downloads, according to the available data) and Abstracts Views on Vision4Press platform.
Data correspond to usage on the plateform after 2015. The current usage metrics is available 48-96 hours after online publication and is updated daily on week days.
Initial download of the metrics may take a while.