Fig. 8
Download original image
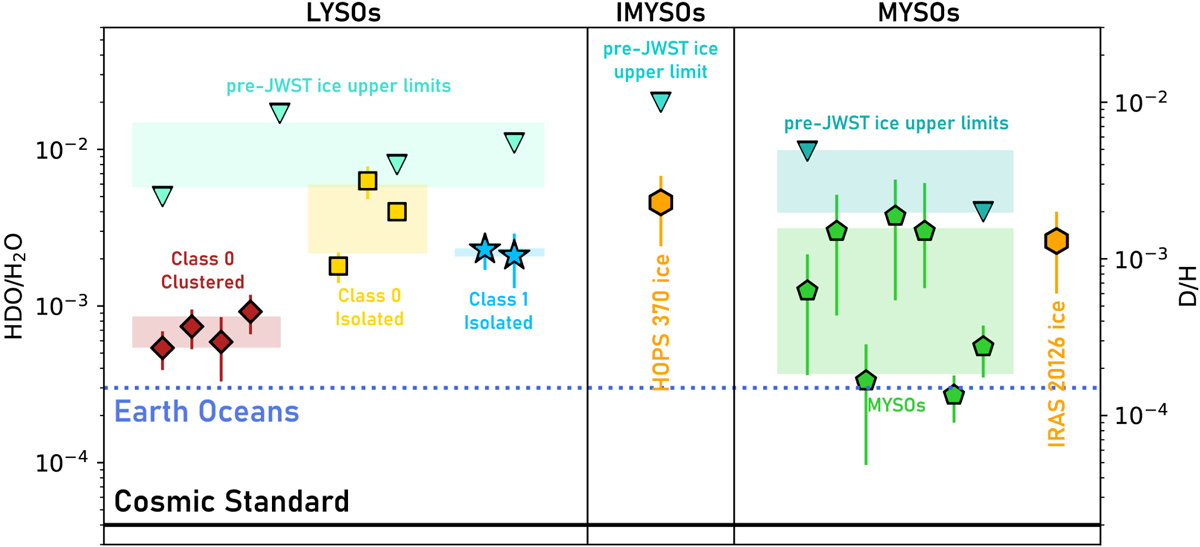
Comparison of HDO/H2O ratios measured in the gas and ice toward protostars of various masses (adapted from Jensen et al. 2019 and Andreu et al. 2023). Ratios measured in the gas phase are plotted with red diamonds for clustered Class 0 LYSOs, yellow squares for isolated Class 0 LYSOs, blue stars for isolated Class 1 LYSOs, and green pentagons for MYSOs. Ice upper limits derived from pre-JWST spectra are plotted with teal triangles. The JWST ice values from this work are plotted with orange hexagons. The literature values used in this figure are provided in Table D.1.
Current usage metrics show cumulative count of Article Views (full-text article views including HTML views, PDF and ePub downloads, according to the available data) and Abstracts Views on Vision4Press platform.
Data correspond to usage on the plateform after 2015. The current usage metrics is available 48-96 hours after online publication and is updated daily on week days.
Initial download of the metrics may take a while.