Fig. 5
Download original image
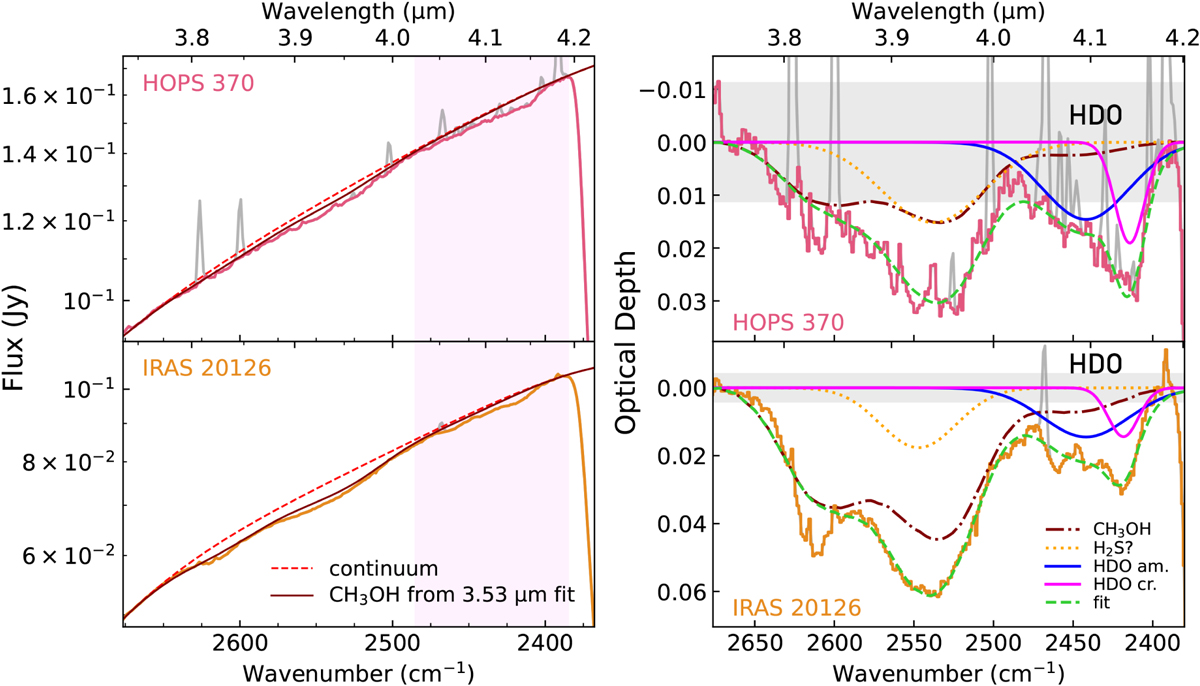
Extraction and fitting of the 4 µm region. Left: adopted local continua, along with CH3OH spectra determined from the 3.53 µm band fitting used to aid the continuum placement. The spectral region of the HDO O–D stretching mode is indicated in magenta. Right: fits to the extracted optical depth spectra (am. = amorphous; cr. = crystalline). The shaded gray regions indicate 3σ uncertainty levels. The same combination of pure and H2O-rich CH3OH spectra as used to fit the 3.53 µm feature is used in this fit. The best-fitting temperatures of the amorphous and crystalline HDO ice components are 132 K and 47 K for HOPS 370 and 138 K and 90 K for IRAS 20126, respectively (see Sect. 3.3 and Appendix B for more details).
Current usage metrics show cumulative count of Article Views (full-text article views including HTML views, PDF and ePub downloads, according to the available data) and Abstracts Views on Vision4Press platform.
Data correspond to usage on the plateform after 2015. The current usage metrics is available 48-96 hours after online publication and is updated daily on week days.
Initial download of the metrics may take a while.