Fig. 4
Download original image
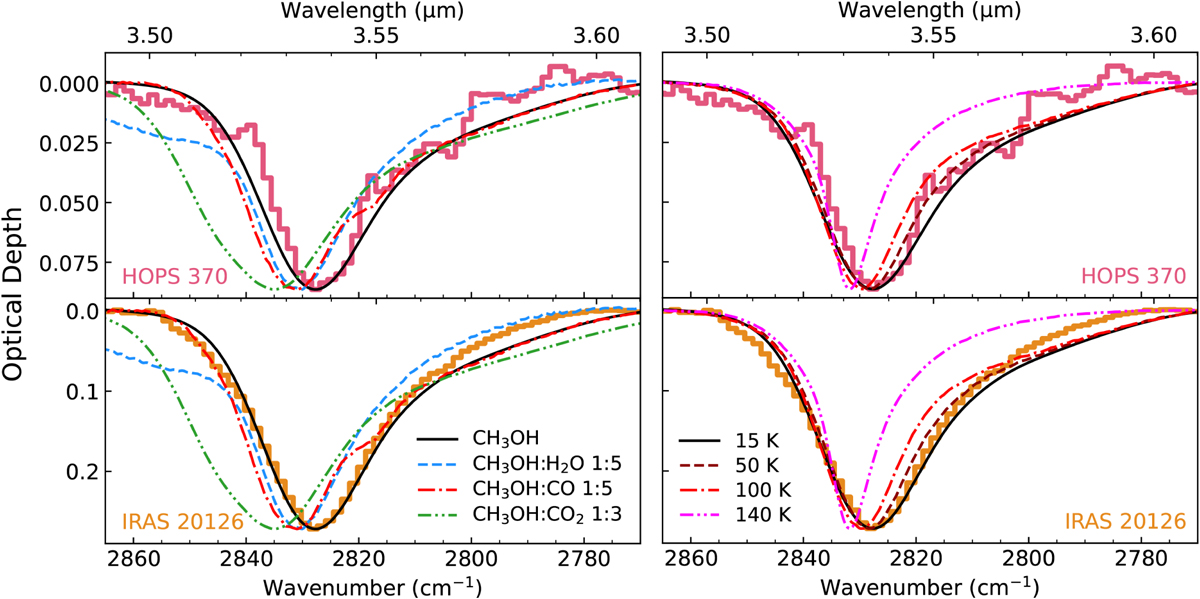
Observed CH3OH C–H symmetric stretching modes compared to select laboratory data. The peaks were extracted from the 3.5 µm absorption complexes via a local continuum fit using baseline points in the range ~3.47–3.50 and 3.60–3.62 µm (Fig. 3). It is clear from these comparisons that cold, amorphous, and relatively pure CH3OH is the major contributor to this feature. Left: observed peaks vs. laboratory spectra of CH3OH ice in various chemical environments. All spectra were collected at 15 K except the CH3OH:CO2 spectrum, which was collected at 10 K (Ehrenfreund et al. 1999). Right: observed peaks vs. laboratory spectra of pure CH3OH ice at various temperatures.
Current usage metrics show cumulative count of Article Views (full-text article views including HTML views, PDF and ePub downloads, according to the available data) and Abstracts Views on Vision4Press platform.
Data correspond to usage on the plateform after 2015. The current usage metrics is available 48-96 hours after online publication and is updated daily on week days.
Initial download of the metrics may take a while.