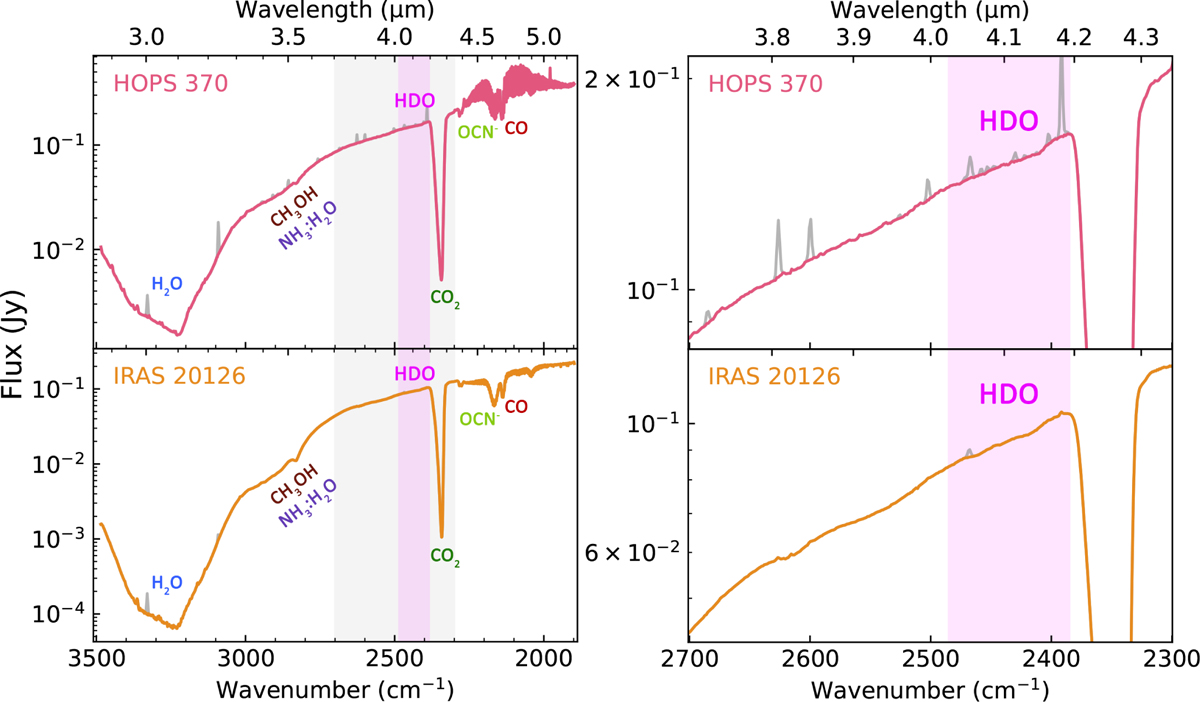
Fig. 2
Download original image
Extracted spectra of the investigated sources. Left: full NIRSpec spectra with major ice features labeled. The original spectra before gas emission subtraction are plotted in gray. The spectral region of the strongest HDO absorption, the O–D stretching mode, is indicated in magenta. The spectral region plotted on the right is indicated in gray. Right: zoomed-in view of the spectral region of interest for HDO ice.
Current usage metrics show cumulative count of Article Views (full-text article views including HTML views, PDF and ePub downloads, according to the available data) and Abstracts Views on Vision4Press platform.
Data correspond to usage on the plateform after 2015. The current usage metrics is available 48-96 hours after online publication and is updated daily on week days.
Initial download of the metrics may take a while.