Fig. C.2
Download original image
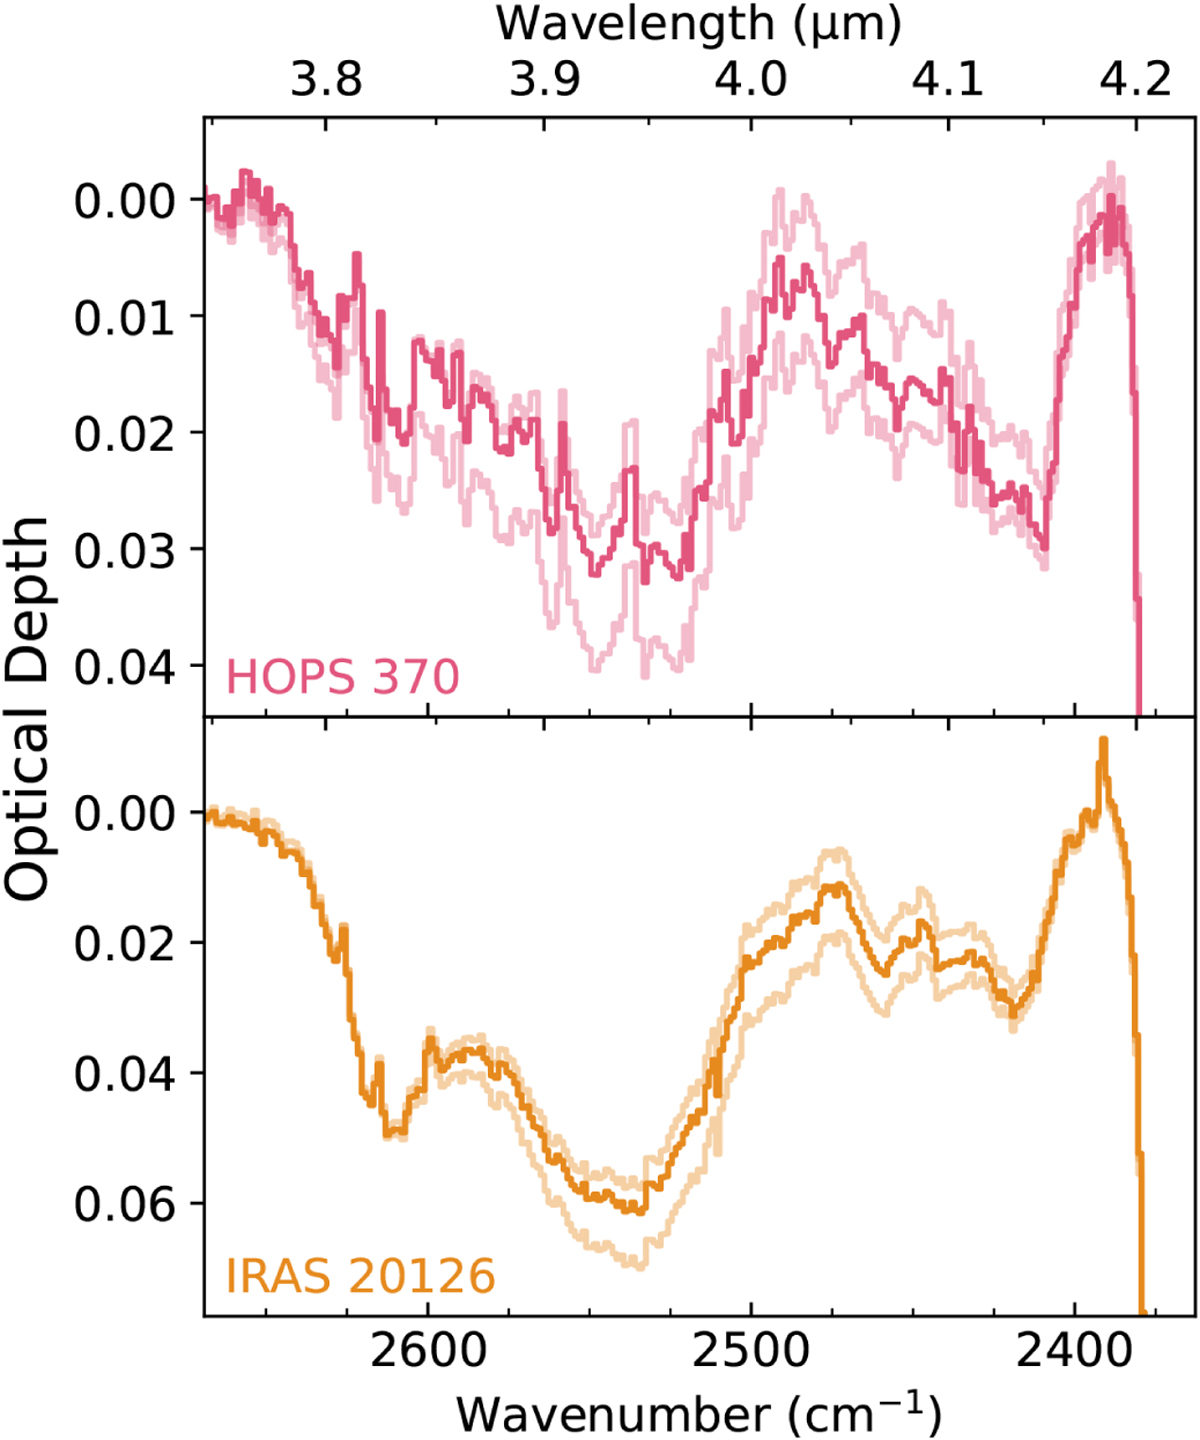
Change in the optical depth of the features at 4 µm caused by varying the local continua, as shown in Figure C.1. The spectra used to calculate the column densities in Table 4 are plotted in darker shades, and the spectra resulting from the lower and upper continuum limits used to estimate the effect of continuum uncertainty are plotted in lighter shades.
Current usage metrics show cumulative count of Article Views (full-text article views including HTML views, PDF and ePub downloads, according to the available data) and Abstracts Views on Vision4Press platform.
Data correspond to usage on the plateform after 2015. The current usage metrics is available 48-96 hours after online publication and is updated daily on week days.
Initial download of the metrics may take a while.