Open Access
Fig. B.1
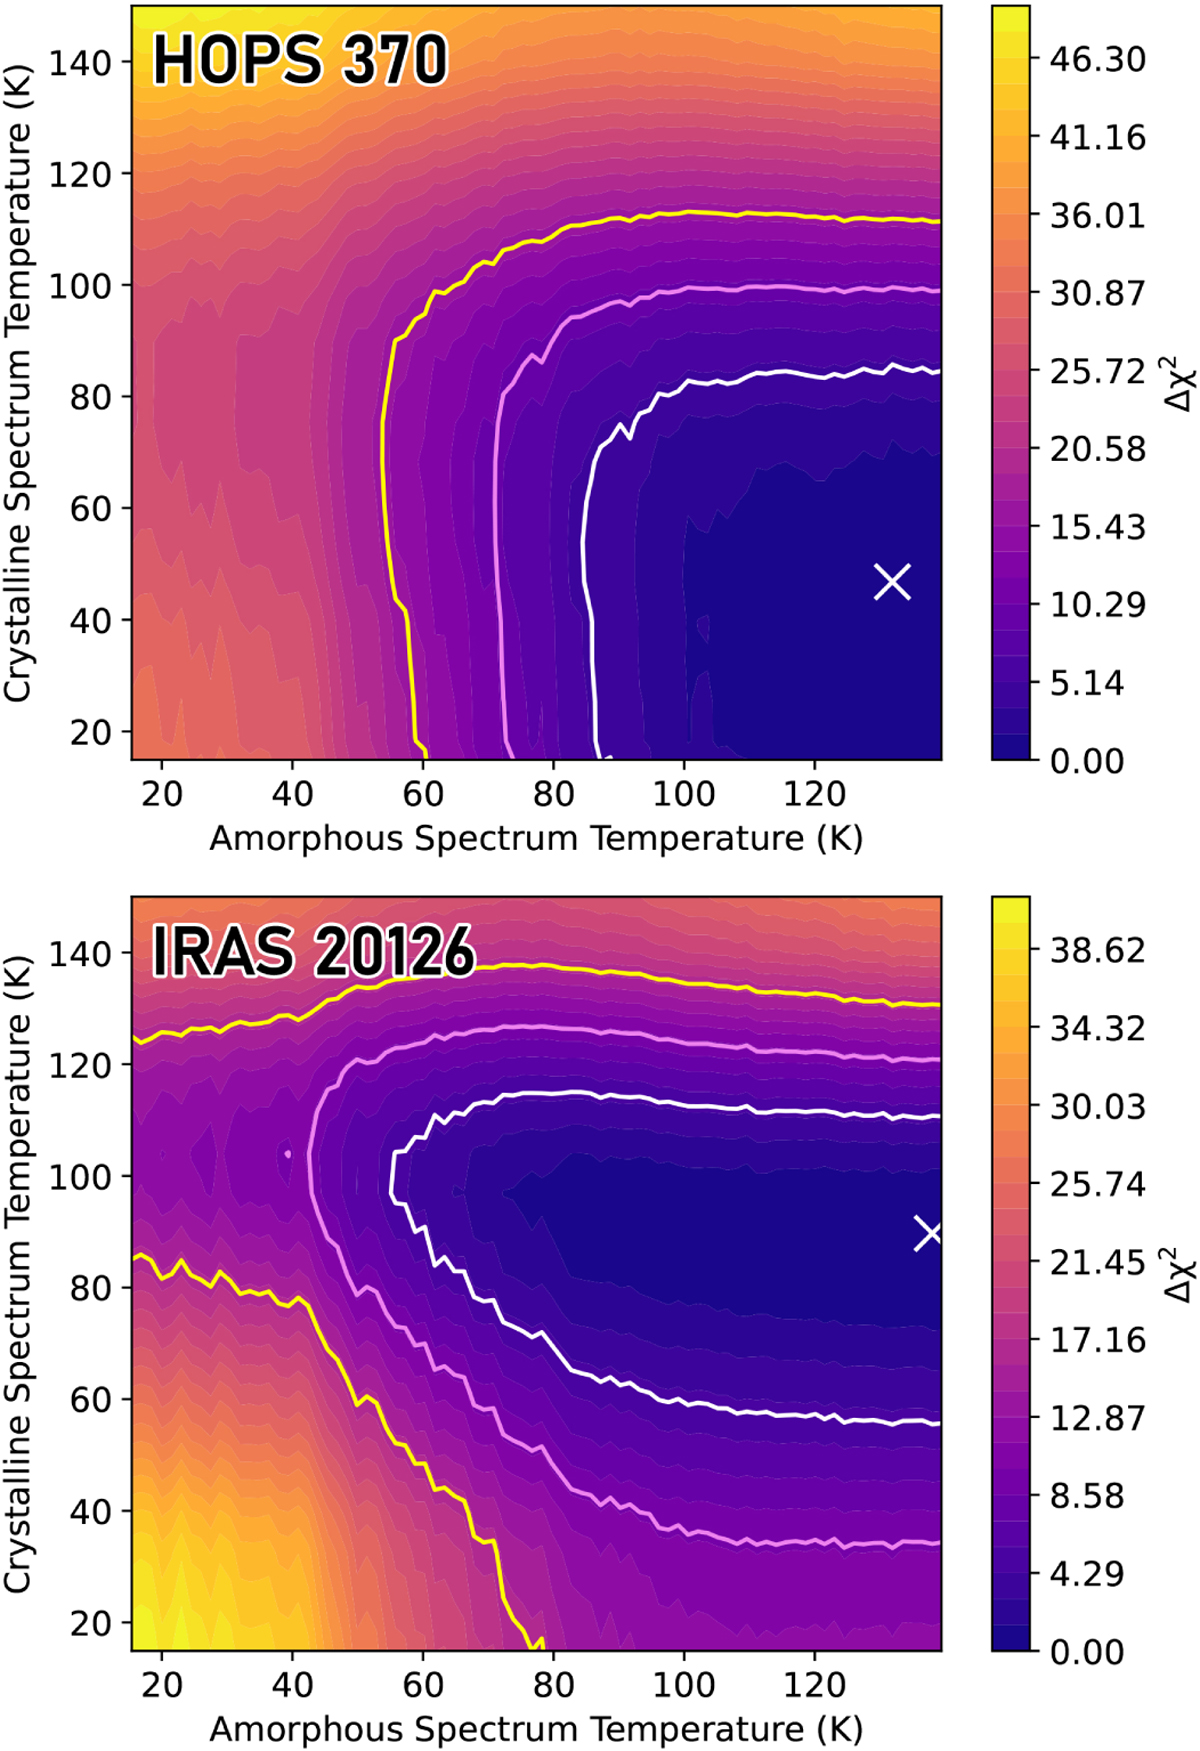
Download original image
Contour maps of the ∆χ2 values of the least-squares fits with every possible combination of one amorphous and one crystalline HDO component. The white X marks χ2min, and the white, purple, and yellow contour lines show the ∆χ2 values corresponding to 1, 2, and 3σ, respectively.
Current usage metrics show cumulative count of Article Views (full-text article views including HTML views, PDF and ePub downloads, according to the available data) and Abstracts Views on Vision4Press platform.
Data correspond to usage on the plateform after 2015. The current usage metrics is available 48-96 hours after online publication and is updated daily on week days.
Initial download of the metrics may take a while.