Fig. A.4
Download original image
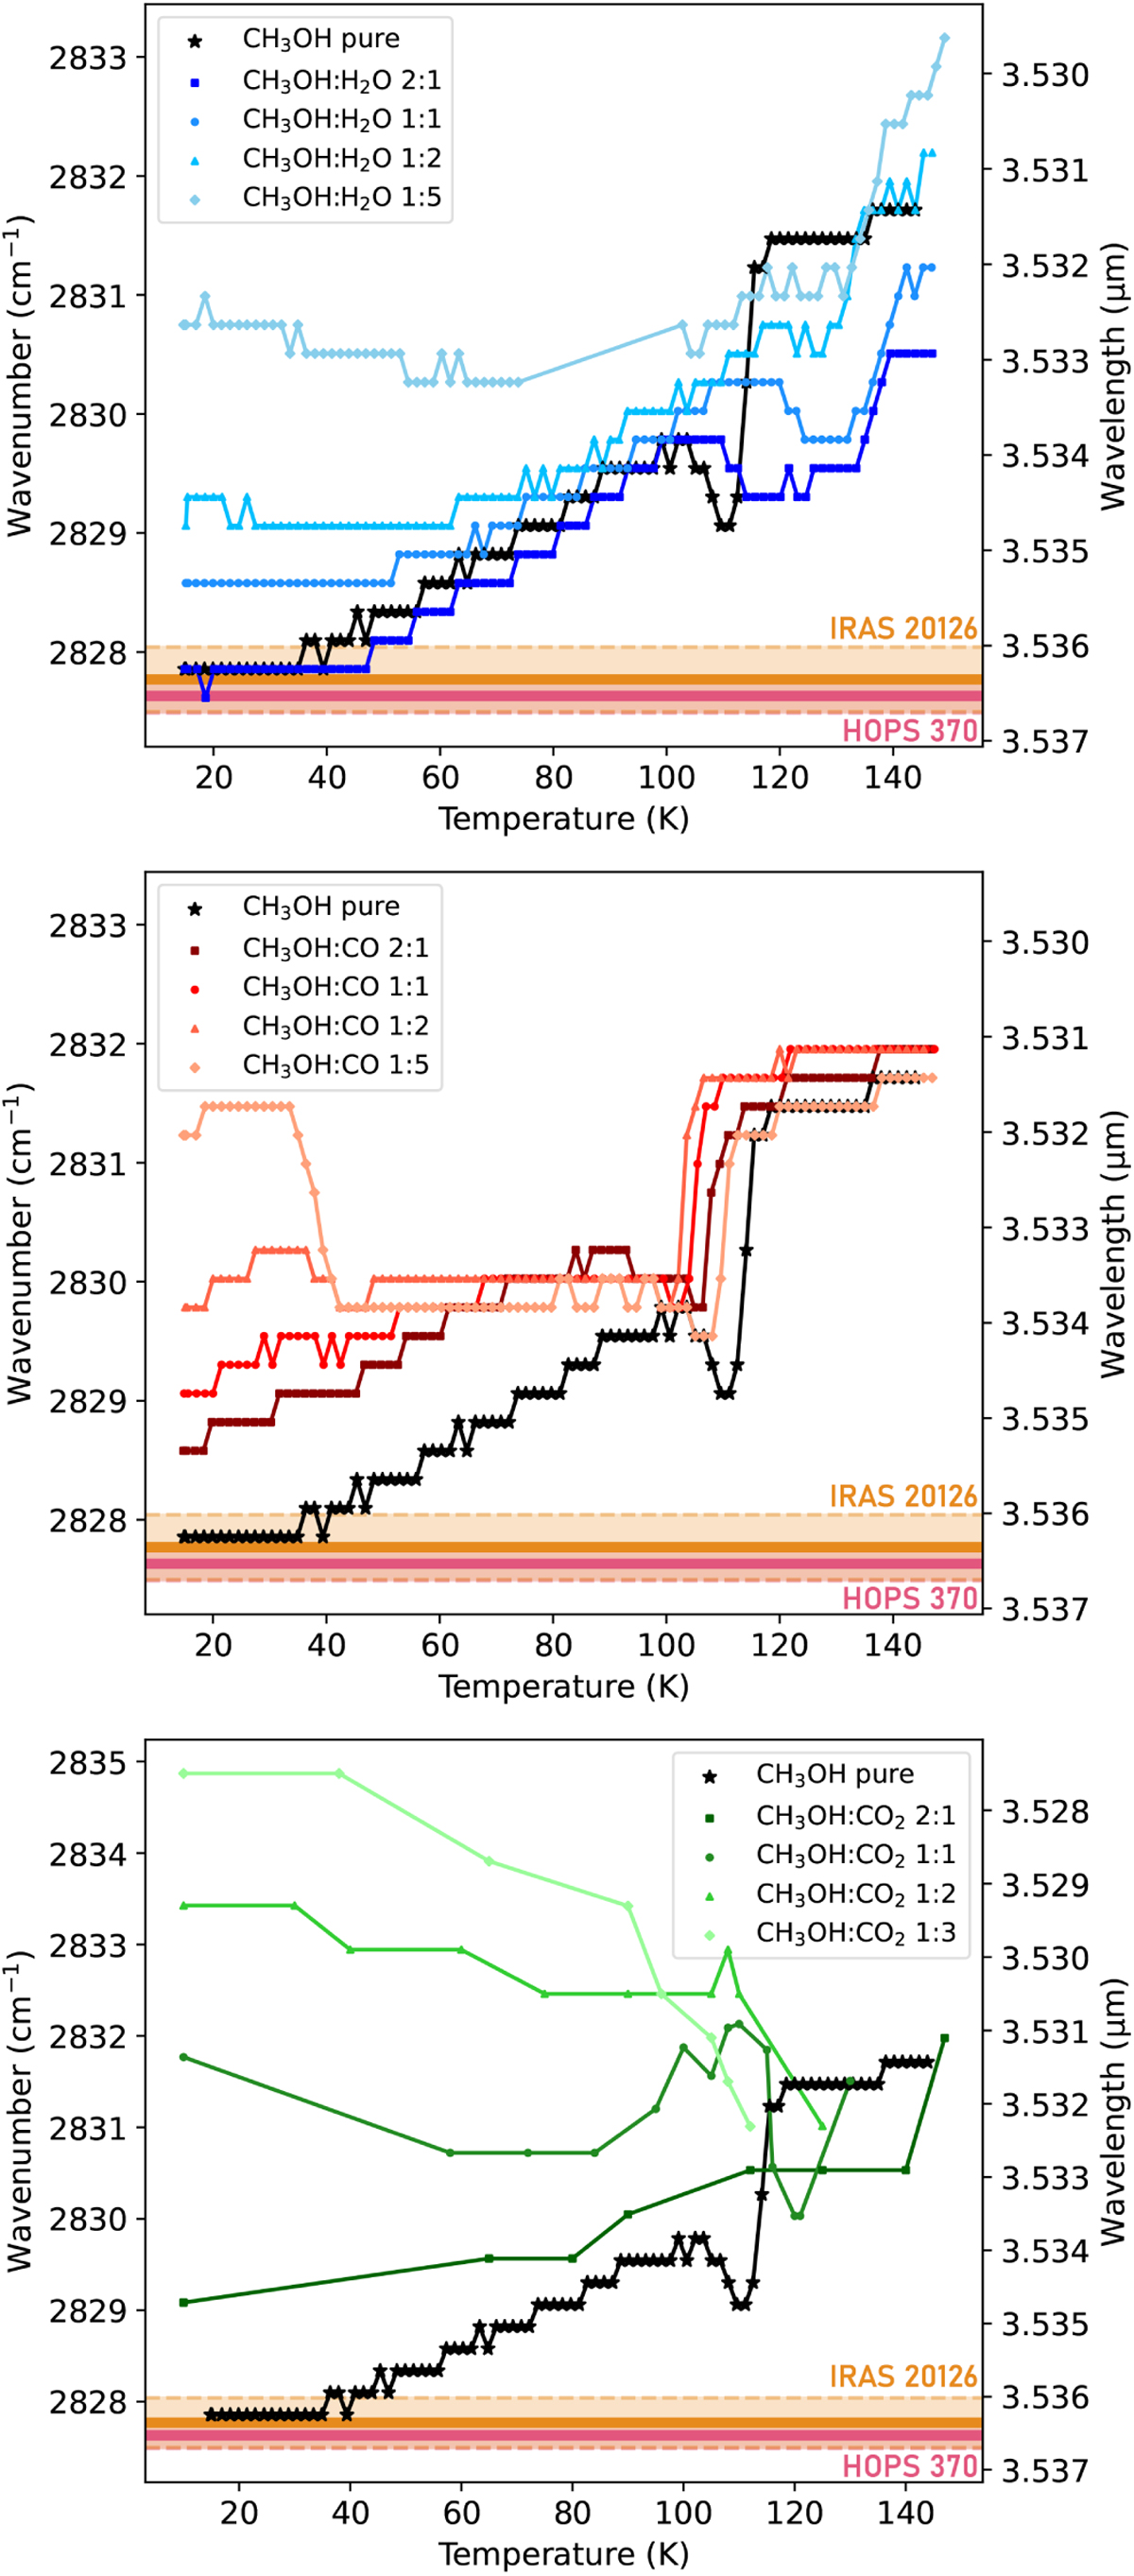
Peak positions oſthe3.53 µm CH3OH C-H stretching mode in laboratory CH3OH ices from 15–145 K (points), and peak positions of the 3.53 µm band observed toward HOPS 370 and IRAS 20126 (thick horizontal lines). The observed peak positions were extracted from the observed spectra via Gaussian fits to the local-continuum subtracted 3.53 µm peaks (error margins indicated as shaded areas with dashed borders). The CH3OH:CO2 values were extracted from data from Ehren-freund et al. (1999) available on LIDA.
Current usage metrics show cumulative count of Article Views (full-text article views including HTML views, PDF and ePub downloads, according to the available data) and Abstracts Views on Vision4Press platform.
Data correspond to usage on the plateform after 2015. The current usage metrics is available 48-96 hours after online publication and is updated daily on week days.
Initial download of the metrics may take a while.