Fig. 9.
Download original image
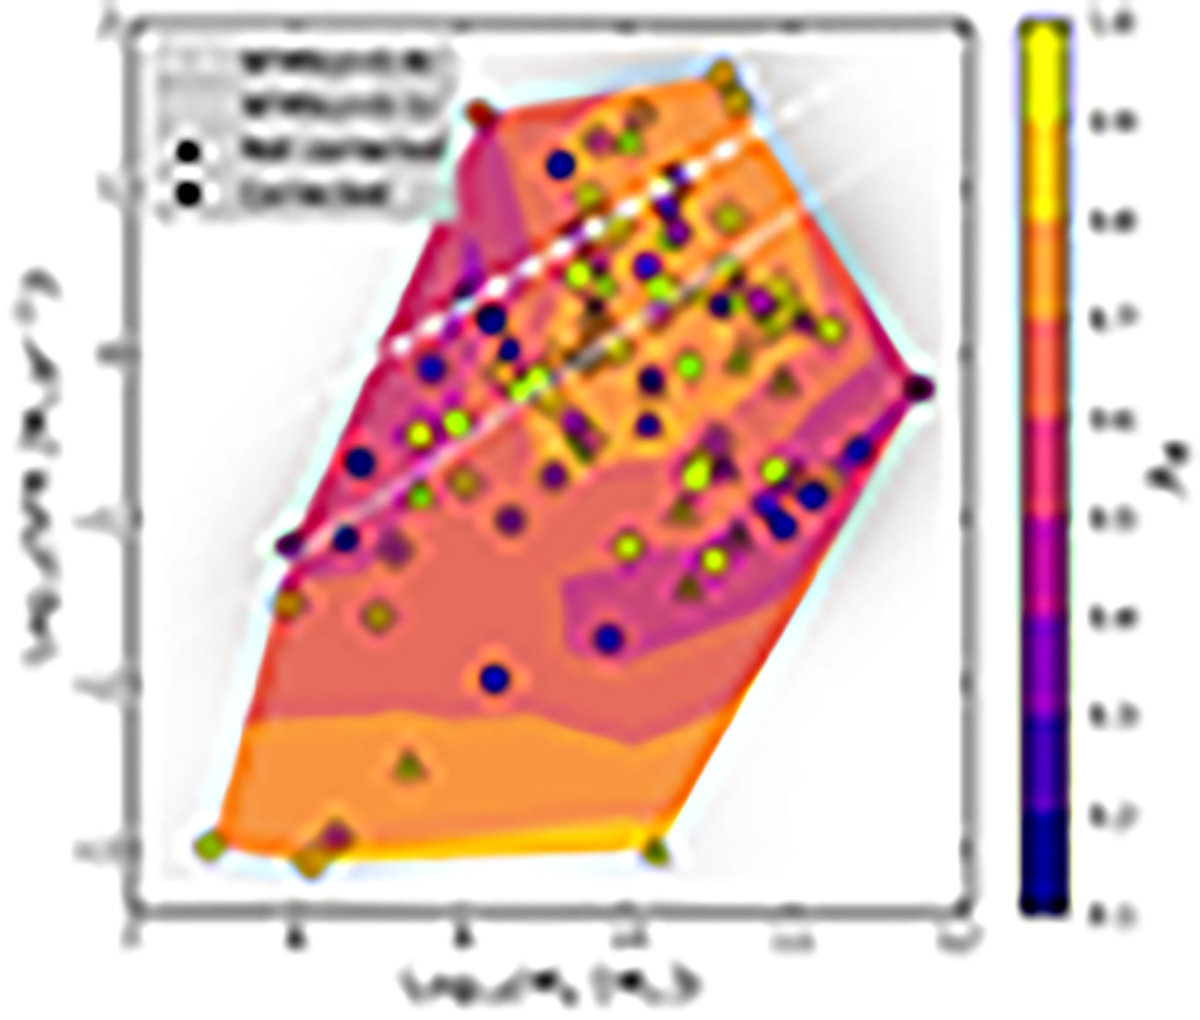
Star formation rate as a function of the stellar mass coloured by λR. The grey-shaded region in the background corresponds to the 3D-HST sample measurement. The dotted and dashed white lines indicate the star formation main sequence for an age of the Universe of 12.4 Gyr (z = 0.1) and 6.8 Gyr (z = 0.8) given by Eq. (1) of Whitaker et al. (2012), respectively. The colour map is a LOESS-smoothed version of the markers on top. Dots and triangles are seeing and not seeing corrected values, respectively.
Current usage metrics show cumulative count of Article Views (full-text article views including HTML views, PDF and ePub downloads, according to the available data) and Abstracts Views on Vision4Press platform.
Data correspond to usage on the plateform after 2015. The current usage metrics is available 48-96 hours after online publication and is updated daily on week days.
Initial download of the metrics may take a while.