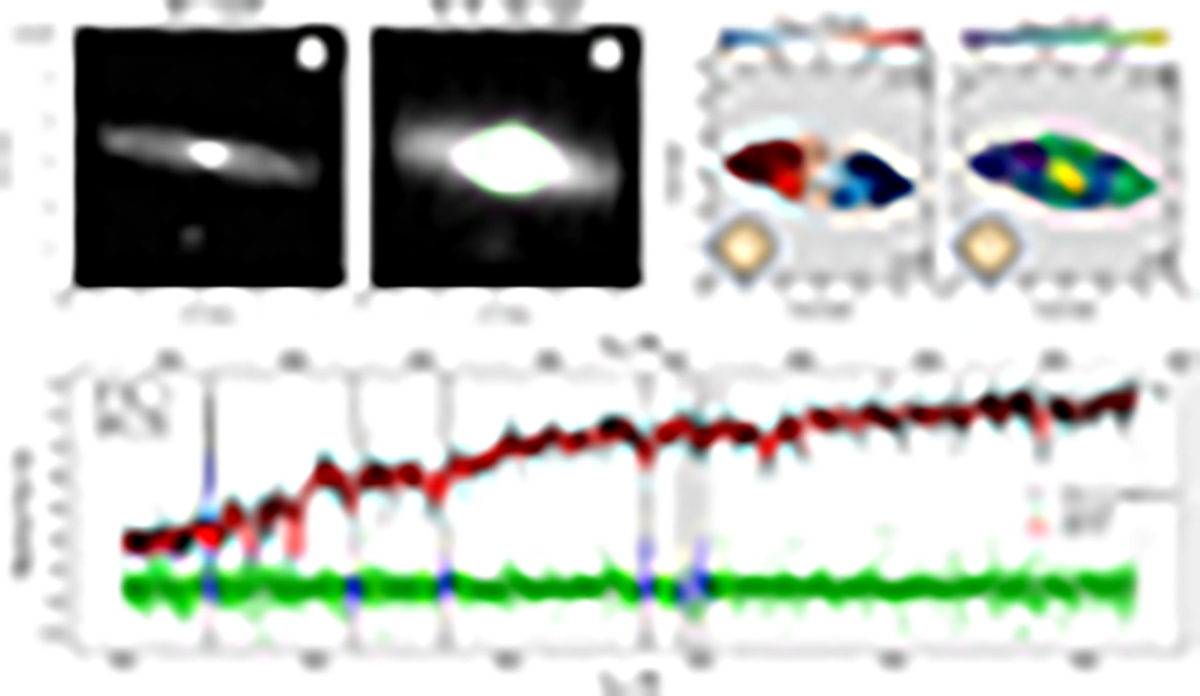
Fig. 3.
Download original image
Example of the kinematics analysis for the galaxy with galaxy 28 in the sample. Panel a: HST image of the galaxy in the F160W band. Panel b: MUSE white light image of the galaxy. The green circle corresponds to the effective radius of the galaxy. Panels c and d: resolved stellar velocity and velocity dispersion maps of the galaxy. The maps are Voronoi binned. The contours are isophotes of the surface brightness plotted with black continuous lines. The number N in the lower right part of each panel denotes the galaxy index according to Table B.1. The velocity and velocity dispersion ranges are shown in different colours (see colour bar at the top of each panel). The inner dashed black line correspond to the ellipse computed using 1Re (half-light ellipse) and the outer ellipse by taking 2Re. Panel e: pPXF fit of the spectrum within the effective radius of the galaxy. The black line indicates the observed spectrum, the red line corresponds to the best fit, the green diamonds are the residuals of the fit, and the shaded grey regions correspond to the masked emission lines. The galaxy N number, the redshift, and the signal-to-noise ratio are indicated in the upper left corner of the panel.
Current usage metrics show cumulative count of Article Views (full-text article views including HTML views, PDF and ePub downloads, according to the available data) and Abstracts Views on Vision4Press platform.
Data correspond to usage on the plateform after 2015. The current usage metrics is available 48-96 hours after online publication and is updated daily on week days.
Initial download of the metrics may take a while.