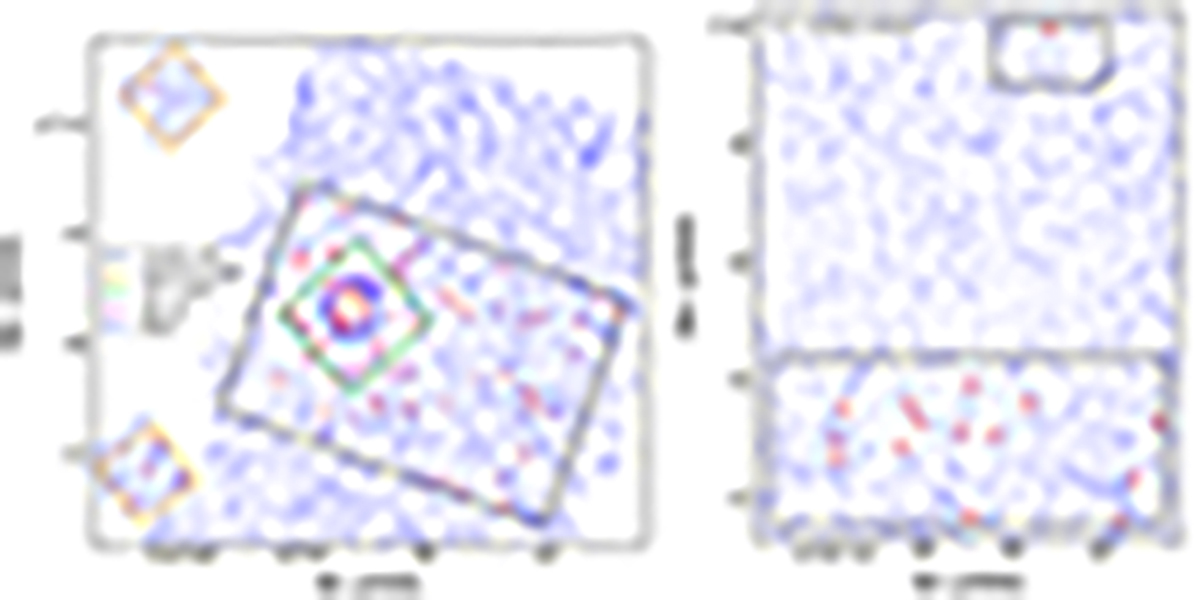
Fig. 1.
Download original image
Layout of the MUSE-Wide regions with the galaxy sample represented by red circles. Left: blue dots correspond to HST/WFC3 objects from the 3D-HST survey in the GOODS-S region brighter than 24 mag in the F160W band. The black, orange, green, purple, and blue contours approximately delimit the candels-cdfs, HUDF09 parallel, UDF mosaic, UDF-10, and MXDF regions, respectively. Right: sample galaxies (red symbols) in the candels-cosmos fields. The black line encloses the area covered by the MUSE-Wide survey. The red and blue symbols are the same as in the left panel. For more details about the fields, see Sect. 2.
Current usage metrics show cumulative count of Article Views (full-text article views including HTML views, PDF and ePub downloads, according to the available data) and Abstracts Views on Vision4Press platform.
Data correspond to usage on the plateform after 2015. The current usage metrics is available 48-96 hours after online publication and is updated daily on week days.
Initial download of the metrics may take a while.