Open Access
Fig. 4.
Download original image
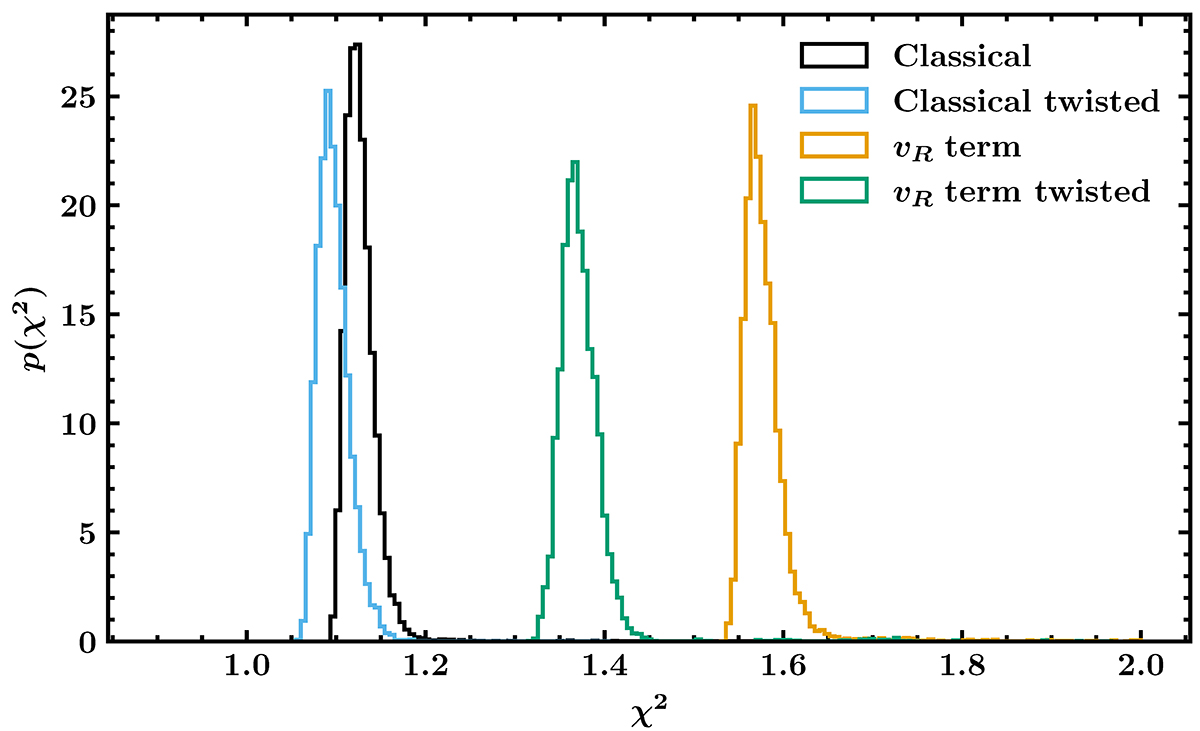
Quantitative comparison of the four models. We compute a quantity analogous to the chi-squared statistic per degree of freedom, ![]() , for each model, and plot the distribution of these values for the final 50 000 steps of the MCMC chain. We note that the Classical models perform significantly better than the vR term.
, for each model, and plot the distribution of these values for the final 50 000 steps of the MCMC chain. We note that the Classical models perform significantly better than the vR term.
Current usage metrics show cumulative count of Article Views (full-text article views including HTML views, PDF and ePub downloads, according to the available data) and Abstracts Views on Vision4Press platform.
Data correspond to usage on the plateform after 2015. The current usage metrics is available 48-96 hours after online publication and is updated daily on week days.
Initial download of the metrics may take a while.