Fig. 7
Download original image
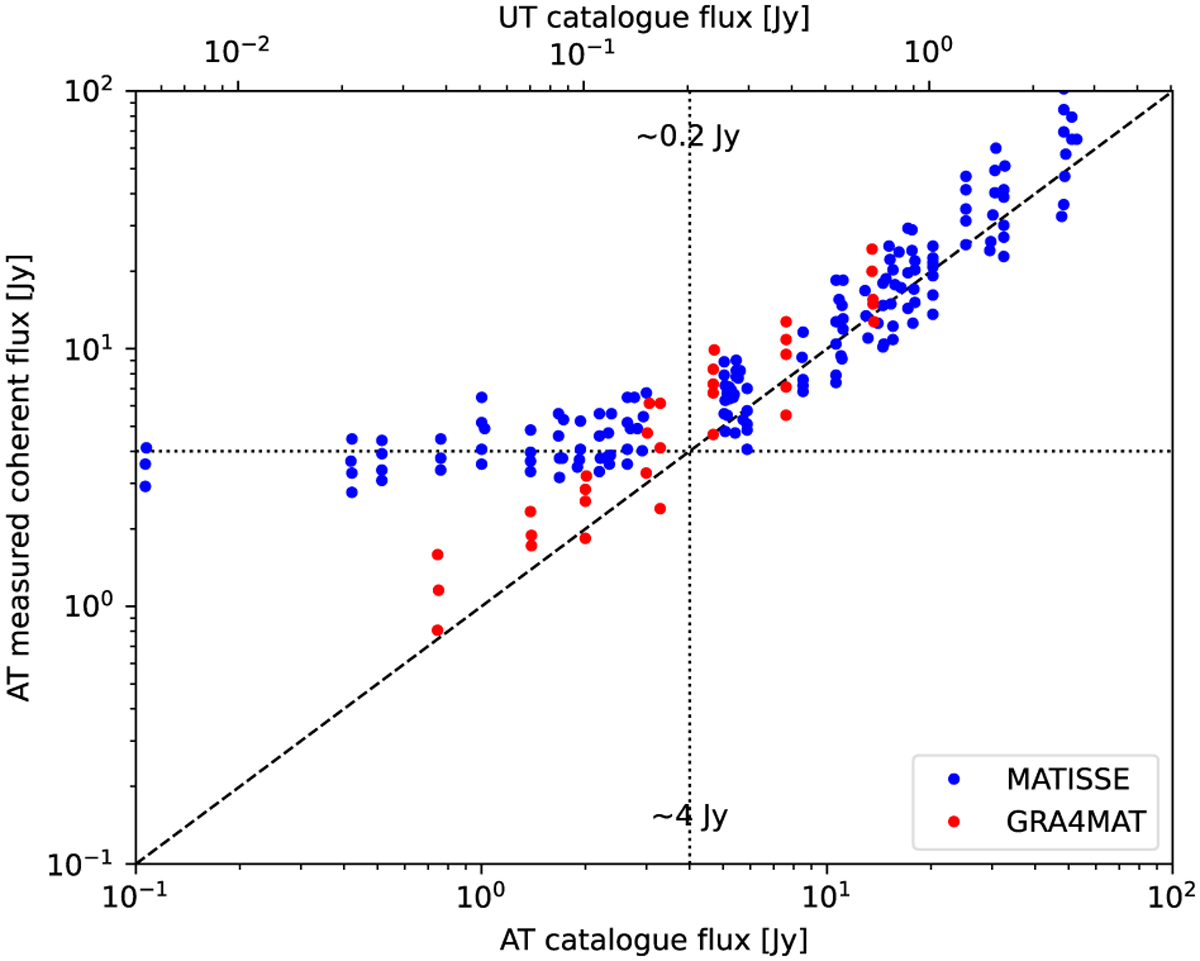
Correlated flux measured with the ATs, and averaged between 8 µm and 9 µm, as a function of the source flux taken from the MDFC catalogue (Cruzalèbes et al. 2019), without fringe tracker (blue) and with fringe tracker (red). The bias generated by the coherent self-integration disappears when fringes are stabilised and the N-band coherent integration is driven by the phase estimated by the fringe tracker.
Current usage metrics show cumulative count of Article Views (full-text article views including HTML views, PDF and ePub downloads, according to the available data) and Abstracts Views on Vision4Press platform.
Data correspond to usage on the plateform after 2015. The current usage metrics is available 48-96 hours after online publication and is updated daily on week days.
Initial download of the metrics may take a while.