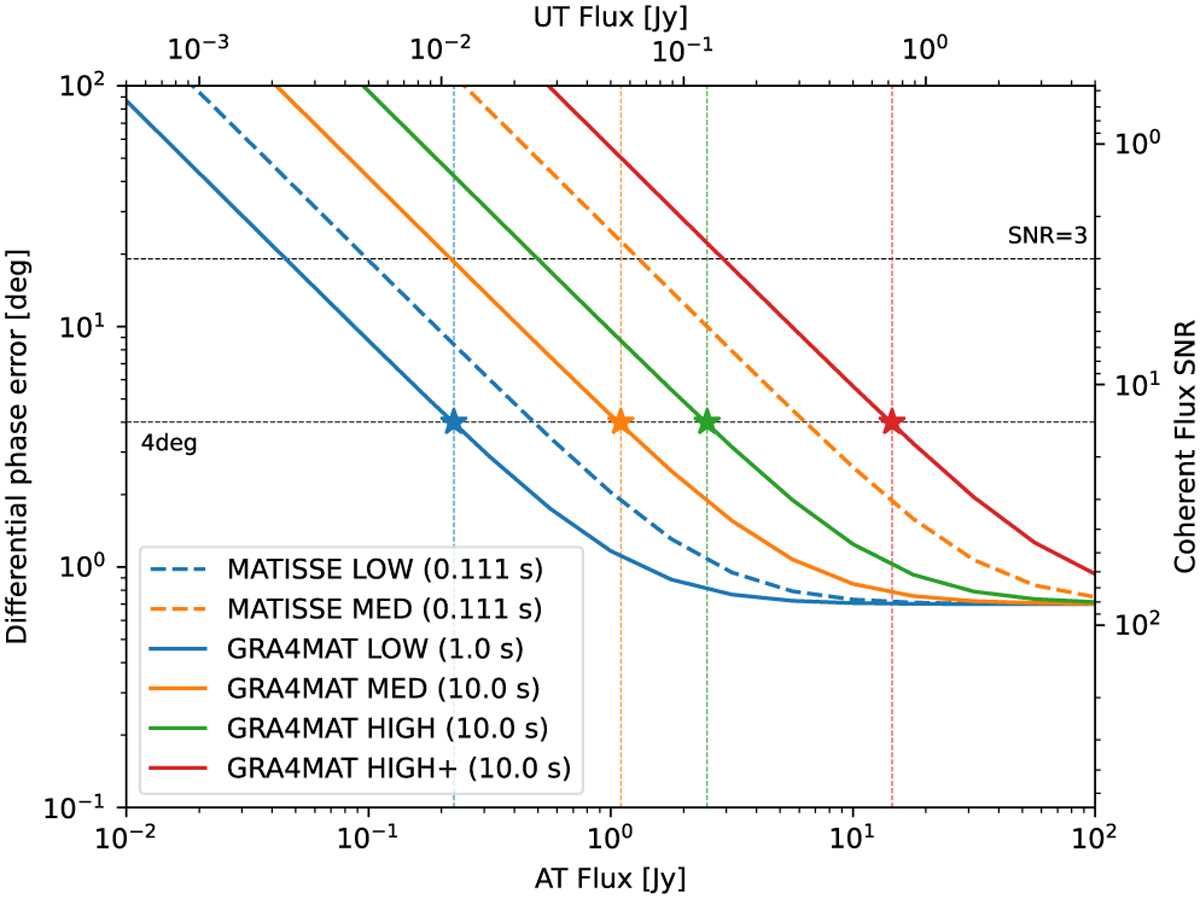
Fig. 6
Download original image
L-band MATISSE (dashed lines) and GRA4MAT (solid lines) differential phase precision (left axis), and associated coherent flux S/N (right axis), per spectral channel, for 1 min total integration, as a function of the target flux, when observed with the ATs (bottom axis) or the UTs (top axis). The coloured lines correspond to the observation-adjusted Exposure Time Calculator predictions for different DIT values and spectral resolutions (Petrov et al. 2020). The highest MATISSE to GRA4MAT gain is observed in medium resolution, where the DIT increases transitions from a read noise to a thermal background regime. The high and high+ resolutions are newly offered with GRA4MAT.
Current usage metrics show cumulative count of Article Views (full-text article views including HTML views, PDF and ePub downloads, according to the available data) and Abstracts Views on Vision4Press platform.
Data correspond to usage on the plateform after 2015. The current usage metrics is available 48-96 hours after online publication and is updated daily on week days.
Initial download of the metrics may take a while.