Fig. 3
Download original image
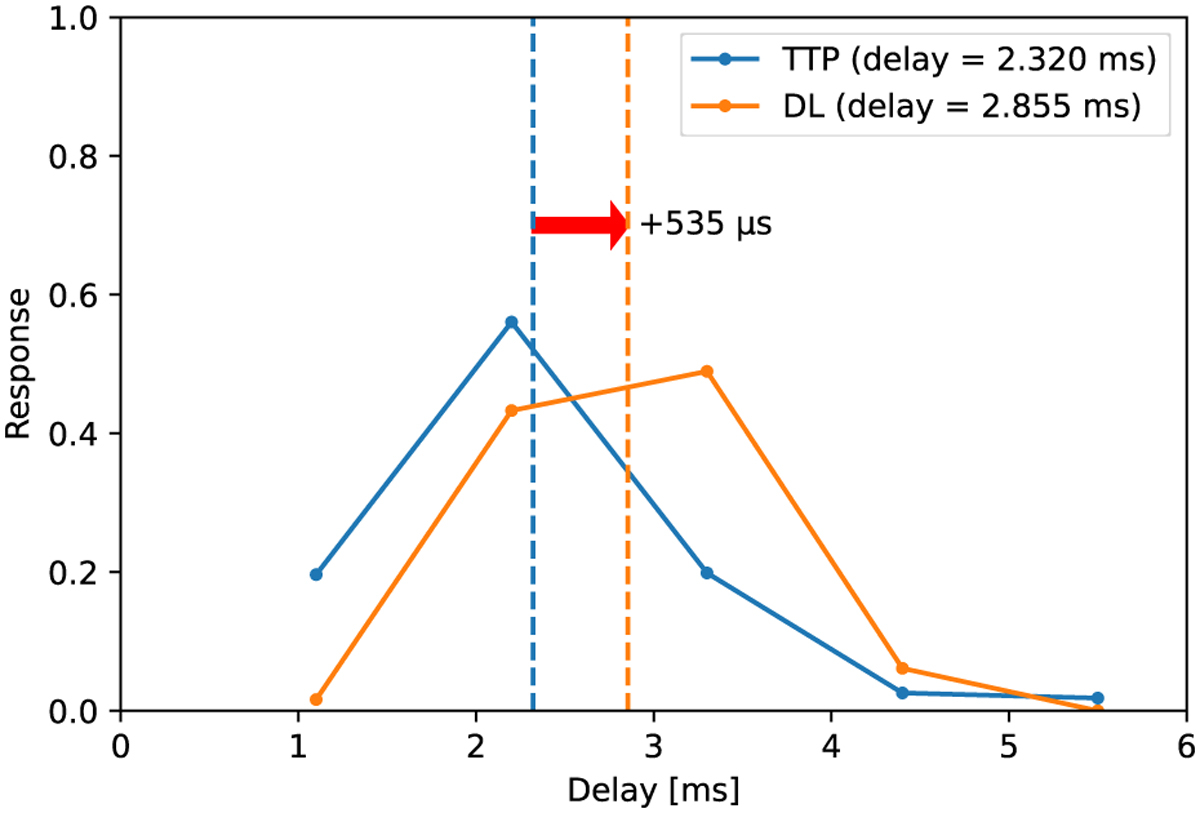
Comparison of the normalised impulse response (solid lines) at 1.1 ms integration period between TTP used by GRAVITY standalone, and the main VLTI DL used by GRA4MAT. The weighted average of the impulse response (vertical dashed lines) show an additional latency of ~500 µs. The responses were measured in 2023 after the fringe tracker real-time controller upgrade.
Current usage metrics show cumulative count of Article Views (full-text article views including HTML views, PDF and ePub downloads, according to the available data) and Abstracts Views on Vision4Press platform.
Data correspond to usage on the plateform after 2015. The current usage metrics is available 48-96 hours after online publication and is updated daily on week days.
Initial download of the metrics may take a while.