Fig. 6.
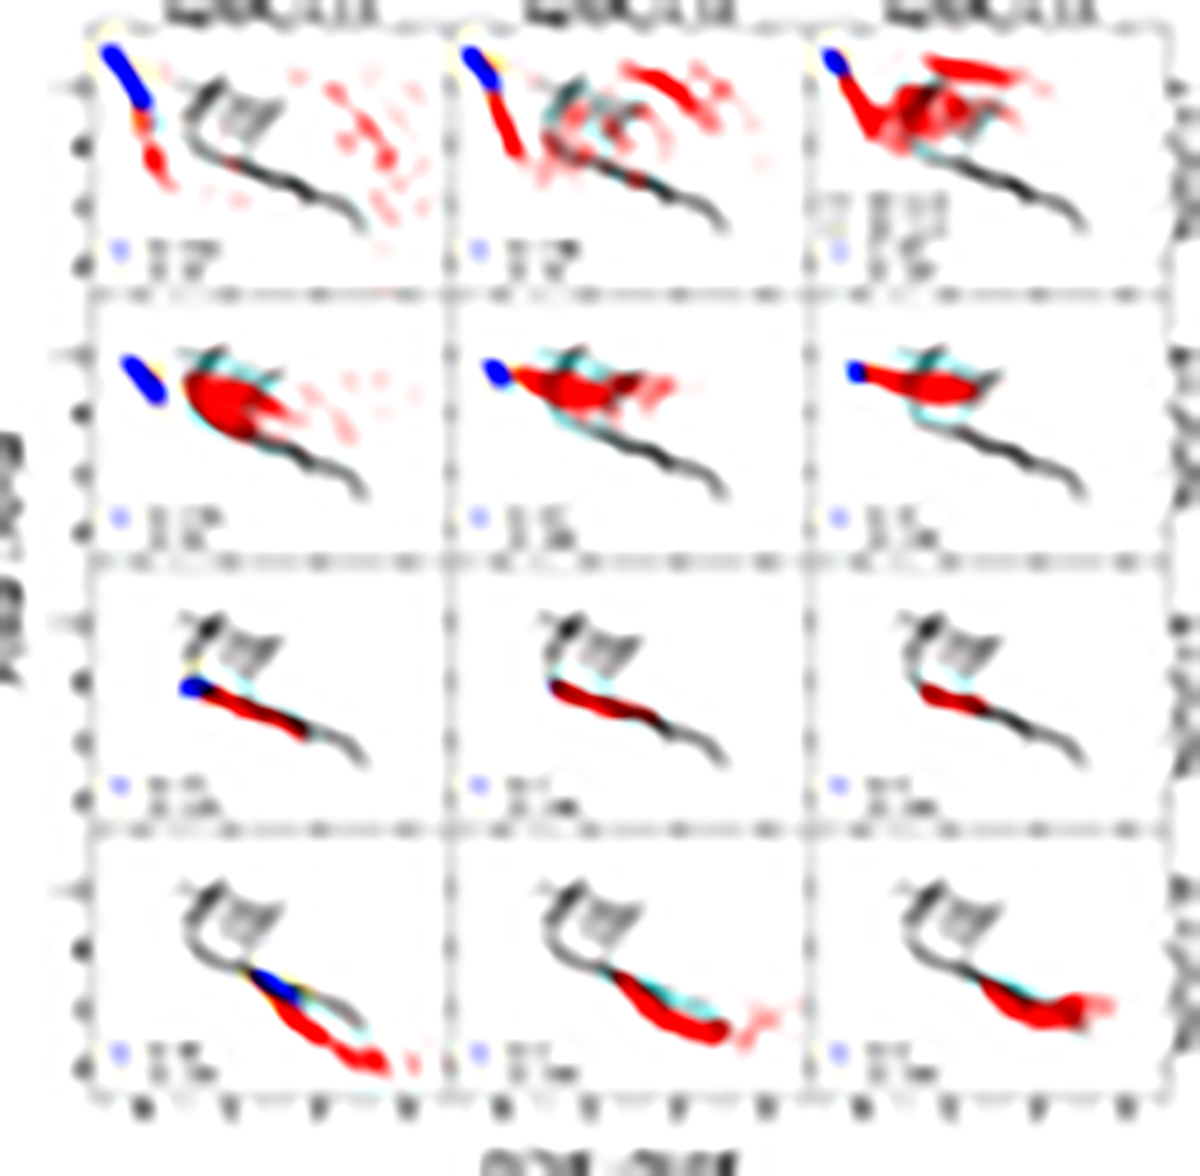
Download original image
TCDs of simulated stochastic star clusters. Each panel shows aperture photometry results for different combinations of cluster mass (marked above the panels) and age (marked to the right of the panels). For the definitions of the G1 and G2 cluster groups, see the text. Black lines (solid – no interstellar extinction; dashed – AV = 1, calculated using the Fitzpatrick 1999 extinction curve) – PARSEC-COLIBRI based non-stochastic SSP solar metallicity models (Marigo et al. 2017) from 10 Myr to 12.6 Gyr. Measurements are performed using the circular aperture of radius Rap = 3.0 arcsec.
Current usage metrics show cumulative count of Article Views (full-text article views including HTML views, PDF and ePub downloads, according to the available data) and Abstracts Views on Vision4Press platform.
Data correspond to usage on the plateform after 2015. The current usage metrics is available 48-96 hours after online publication and is updated daily on week days.
Initial download of the metrics may take a while.