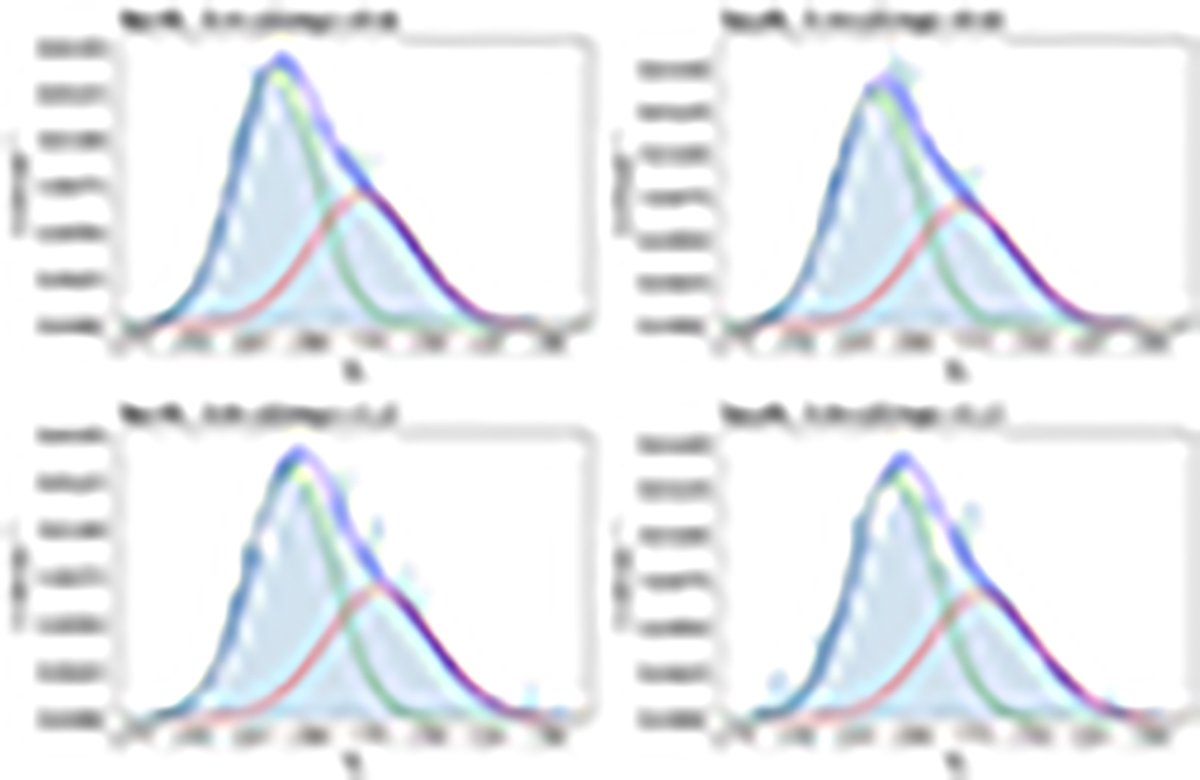
Fig. 7.
Download original image
Comparison of the observed rotational velocity distribution (vϕ) for FGKM stars, shown as histograms, and a two-component model (dashed lines: individual components; solid line: their sum) given by Eq. (3) (using updated parameters discussed in text; the same Z-dependent model is shown in all four panels). The four panels show results for two |Z| bins (top row vs. bottom row) and towards North and South (|b|> 80°, left vs. right). The sample sizes are about 4000 stars for the nearer |Z| bin and about 900 stars for the more distant bin.
Current usage metrics show cumulative count of Article Views (full-text article views including HTML views, PDF and ePub downloads, according to the available data) and Abstracts Views on Vision4Press platform.
Data correspond to usage on the plateform after 2015. The current usage metrics is available 48-96 hours after online publication and is updated daily on week days.
Initial download of the metrics may take a while.