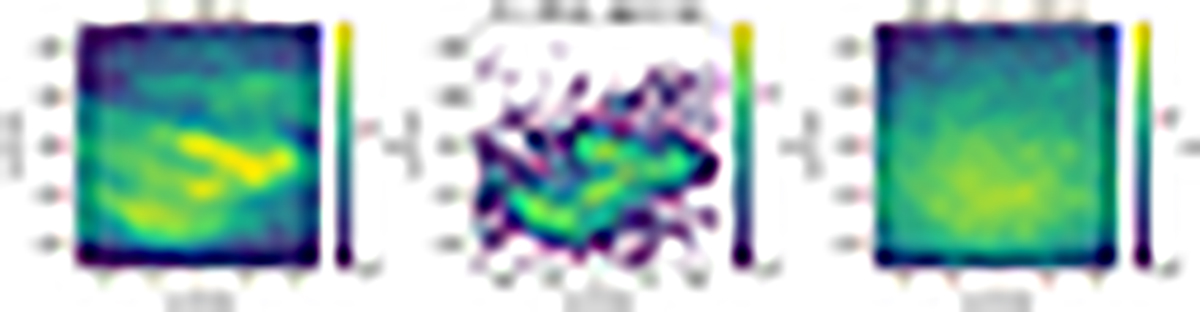
Fig. 13.
Download original image
A comparison of distributions in the vϕ vs. vR diagram for three different samples of disk stars: a nearby sample of 276 453 stars at distances below 300 pc (left), its subsample consisting of 6108 stars younger than 2 Gyr (middle), and a sample of 237 660 stars at distances from the Galactic plane in the range of 400−600 pc. Complex structure, known in the literature as “Eggen’s moving groups”, is evident at distances below 300 pc. For example, the feature at (vR = −25, vϕ = −230) corresponds to the Sirius moving group, the feature at (vR = 0, vϕ = −220) is the Coma B moving group, the feature at (vR = 0, vϕ = −200) is the Pleiades moving group, and the Hyades moving group is seen at (vR = 30, vϕ = −210).
Current usage metrics show cumulative count of Article Views (full-text article views including HTML views, PDF and ePub downloads, according to the available data) and Abstracts Views on Vision4Press platform.
Data correspond to usage on the plateform after 2015. The current usage metrics is available 48-96 hours after online publication and is updated daily on week days.
Initial download of the metrics may take a while.