Fig. 2
Download original image
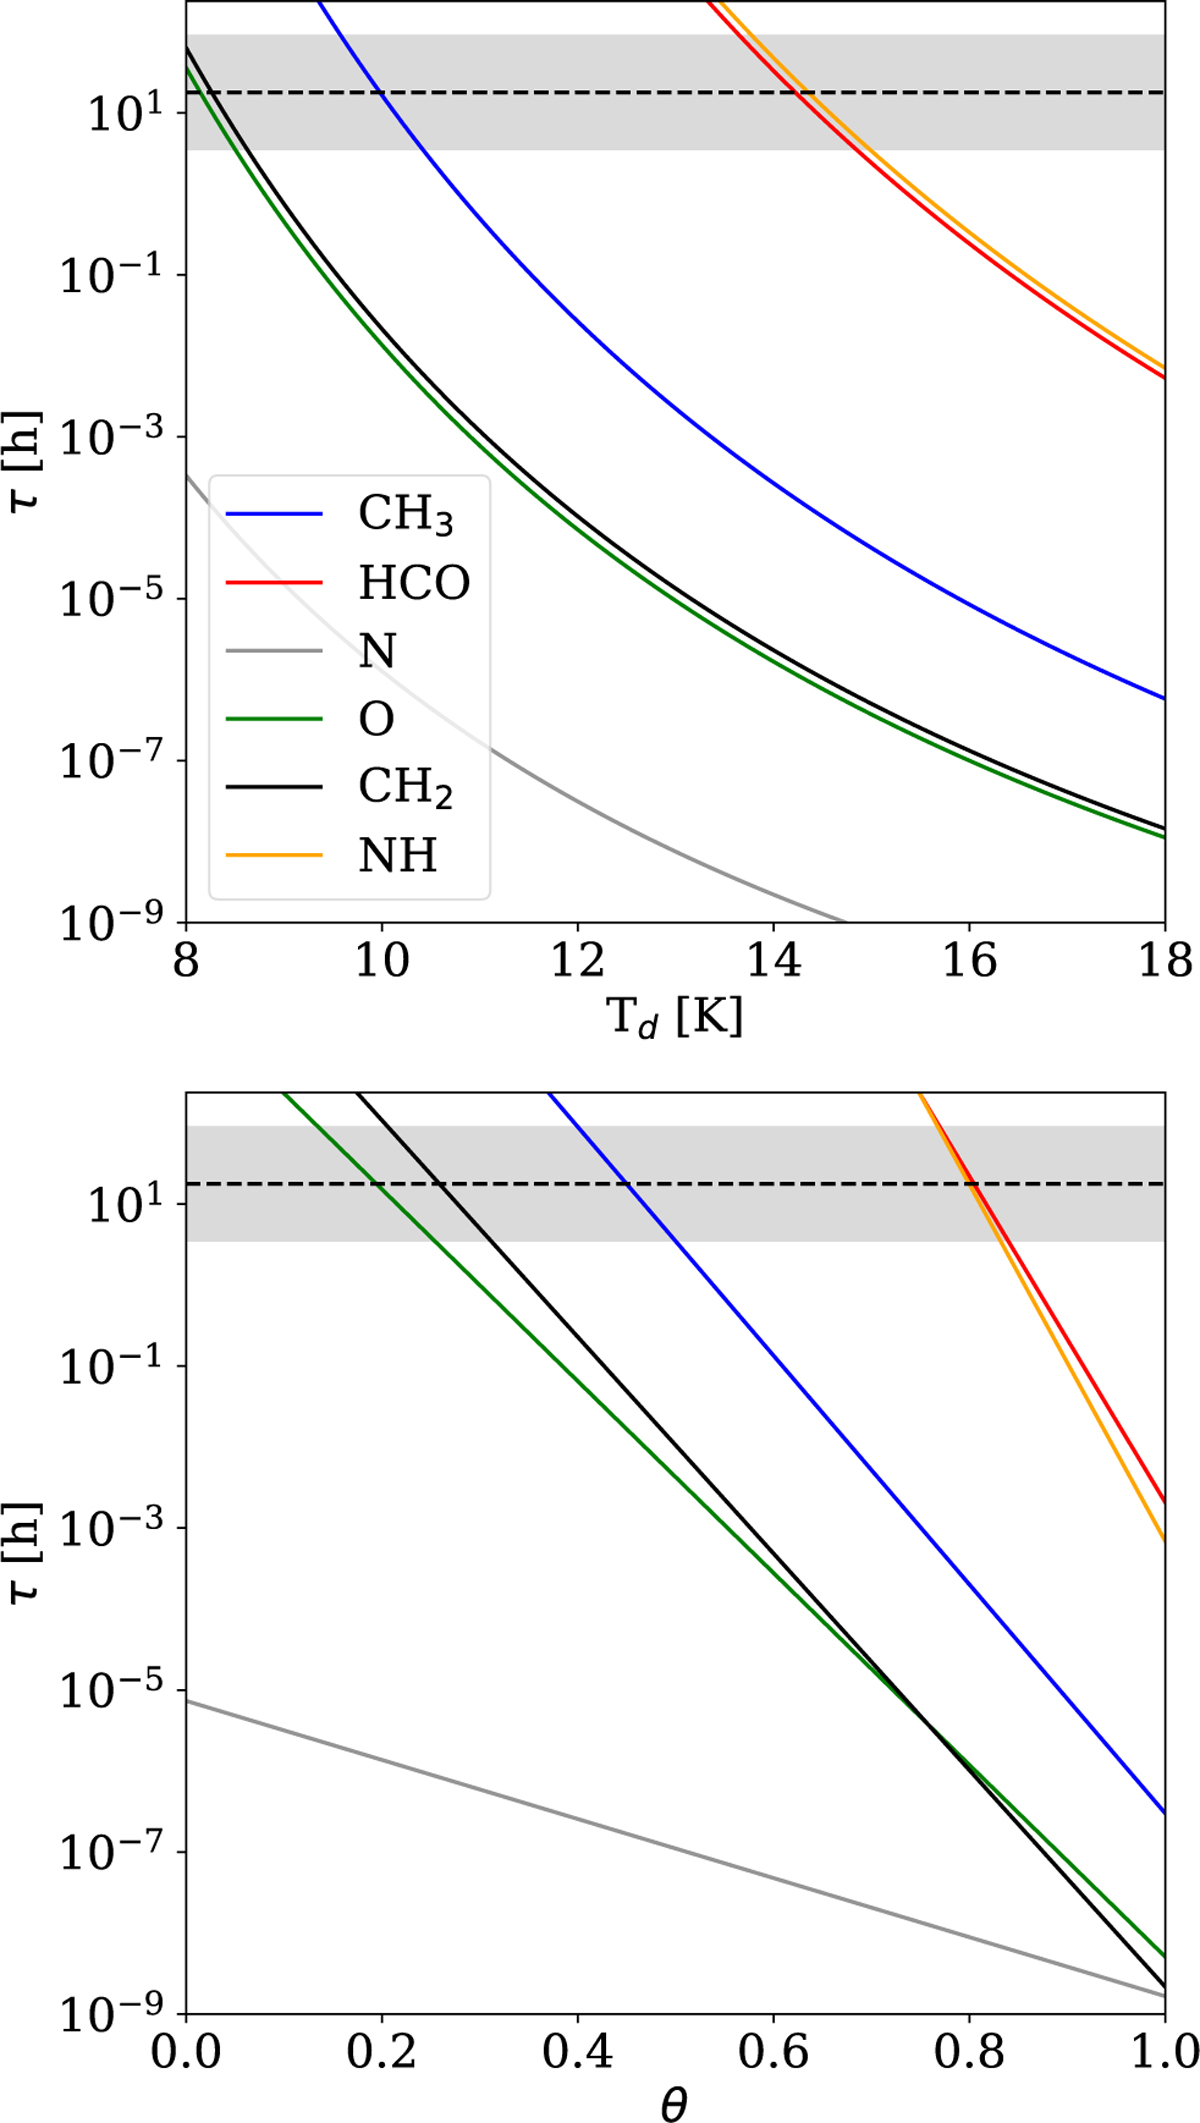
Initial analysis of diffusion timescales. Top: diffusion timescale as a function of the dust temperature (Td) for θ = 0.65 Bottom: as a function of the surface coverage of CO (θ) at 12 K for the main radicals considered (Furuya et al. 2022). The dotted black line and the shaded region around it show the H accretion timescale for different ![]() (see Sec. 3.1).
(see Sec. 3.1).
Current usage metrics show cumulative count of Article Views (full-text article views including HTML views, PDF and ePub downloads, according to the available data) and Abstracts Views on Vision4Press platform.
Data correspond to usage on the plateform after 2015. The current usage metrics is available 48-96 hours after online publication and is updated daily on week days.
Initial download of the metrics may take a while.