Fig. 9
Download original image
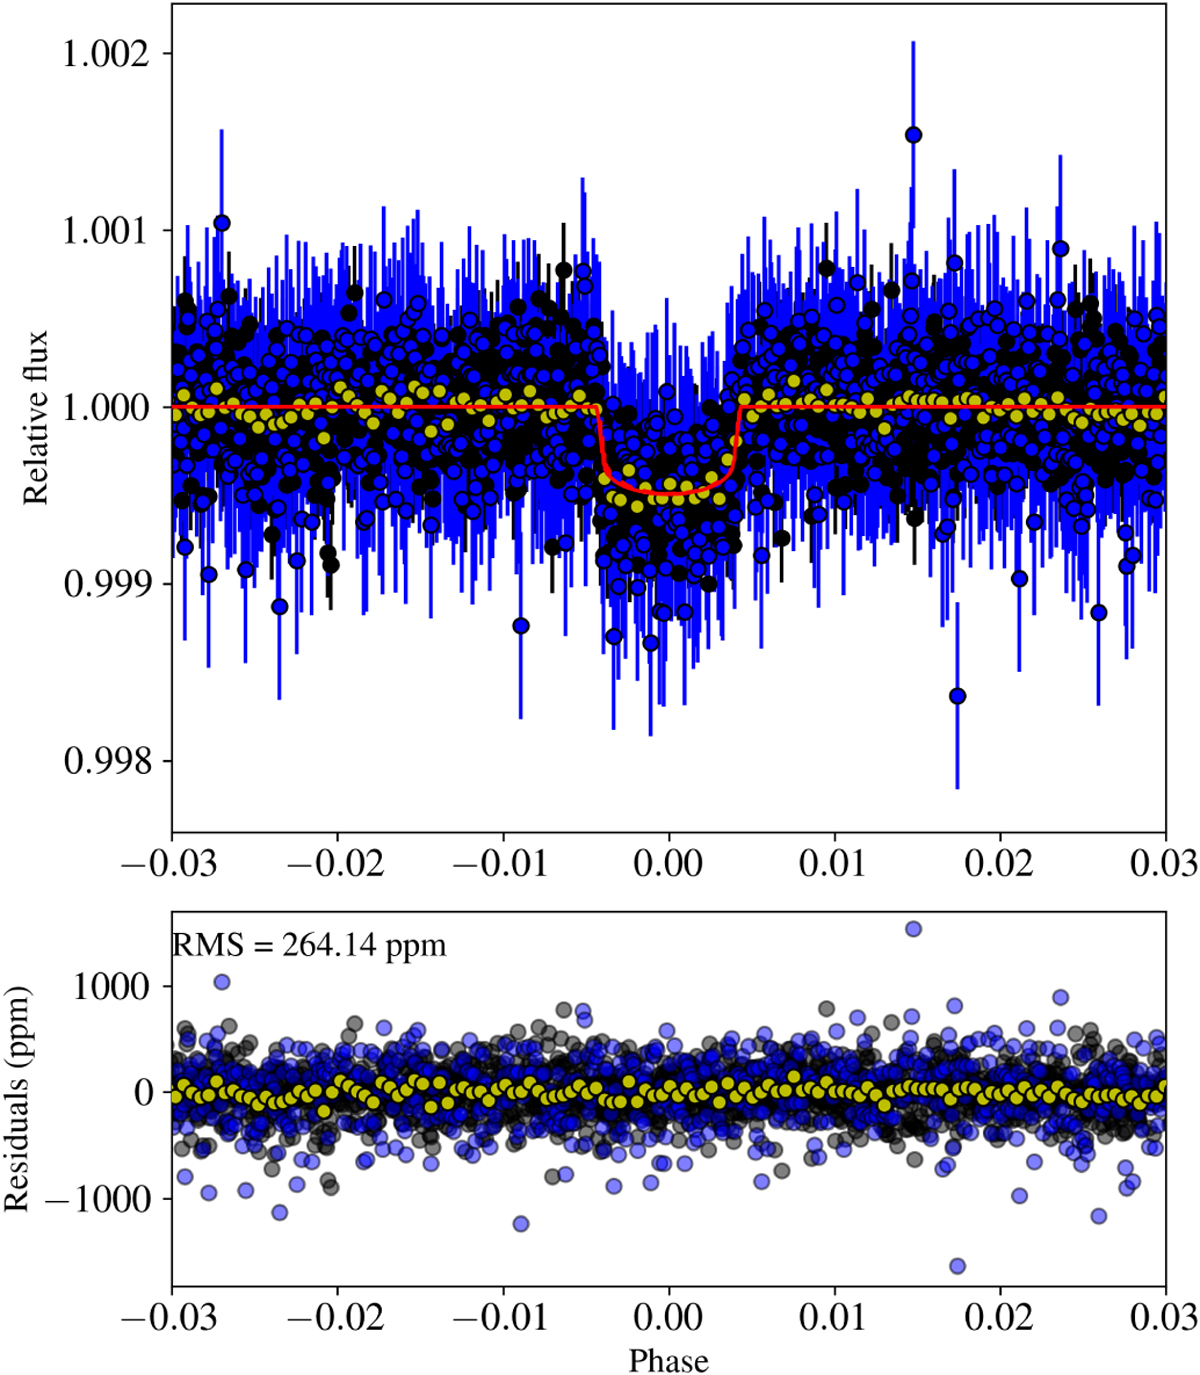
Phased light curve of HD 73344b resulting from the joint analysis of the photometric and RV data. K2 data are shown in black, TESS data in blue. These light curves have been corrected by the best-fitting noise models. The best-fitting transit model is shown in red. Yellow dots represent the 120min binned light curves (K2 and TESS combined).
Current usage metrics show cumulative count of Article Views (full-text article views including HTML views, PDF and ePub downloads, according to the available data) and Abstracts Views on Vision4Press platform.
Data correspond to usage on the plateform after 2015. The current usage metrics is available 48-96 hours after online publication and is updated daily on week days.
Initial download of the metrics may take a while.