Fig. 7
Download original image
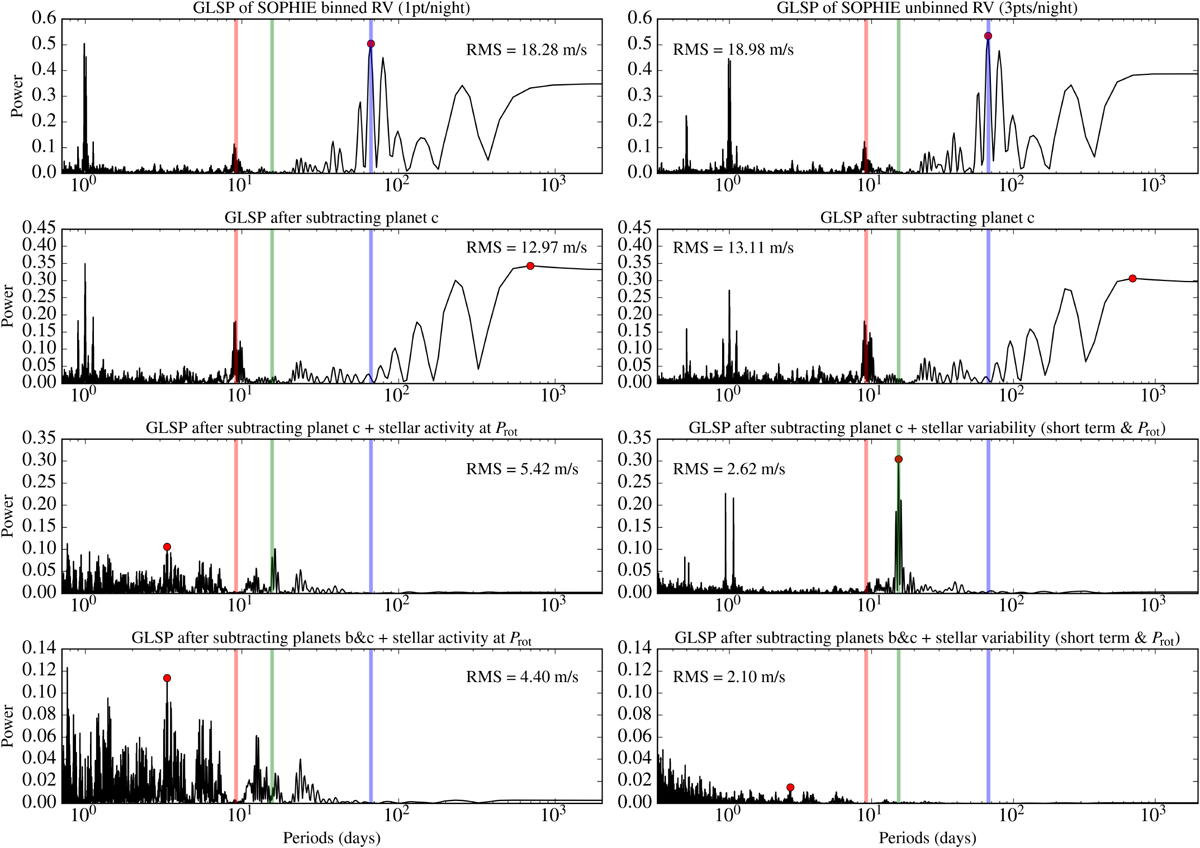
Generalized Lomb-Scargle periodograms of the SOPHIE binned (left) and unbinned (right) data. From top to bottom: Raw data, then subtraction of the best-fitting Keplerian model for the planet candidate, the stellar activity model(s), and planet b. For the stellar activity model(s), we considered the mean of the predictive GP distribution resulting from the best fits. The stellar rotation period, and the orbital period of planets b and c are indicated by the red, green and blue vertical lines, respectively. In each panel, the red dots indicate the highest periodogram peak taken over periods >1 day. We note that the planetary and activity signals are jointly estimated from the RV data, and then iteratively removed in the successive panels.
Current usage metrics show cumulative count of Article Views (full-text article views including HTML views, PDF and ePub downloads, according to the available data) and Abstracts Views on Vision4Press platform.
Data correspond to usage on the plateform after 2015. The current usage metrics is available 48-96 hours after online publication and is updated daily on week days.
Initial download of the metrics may take a while.