Fig. 5
Download original image
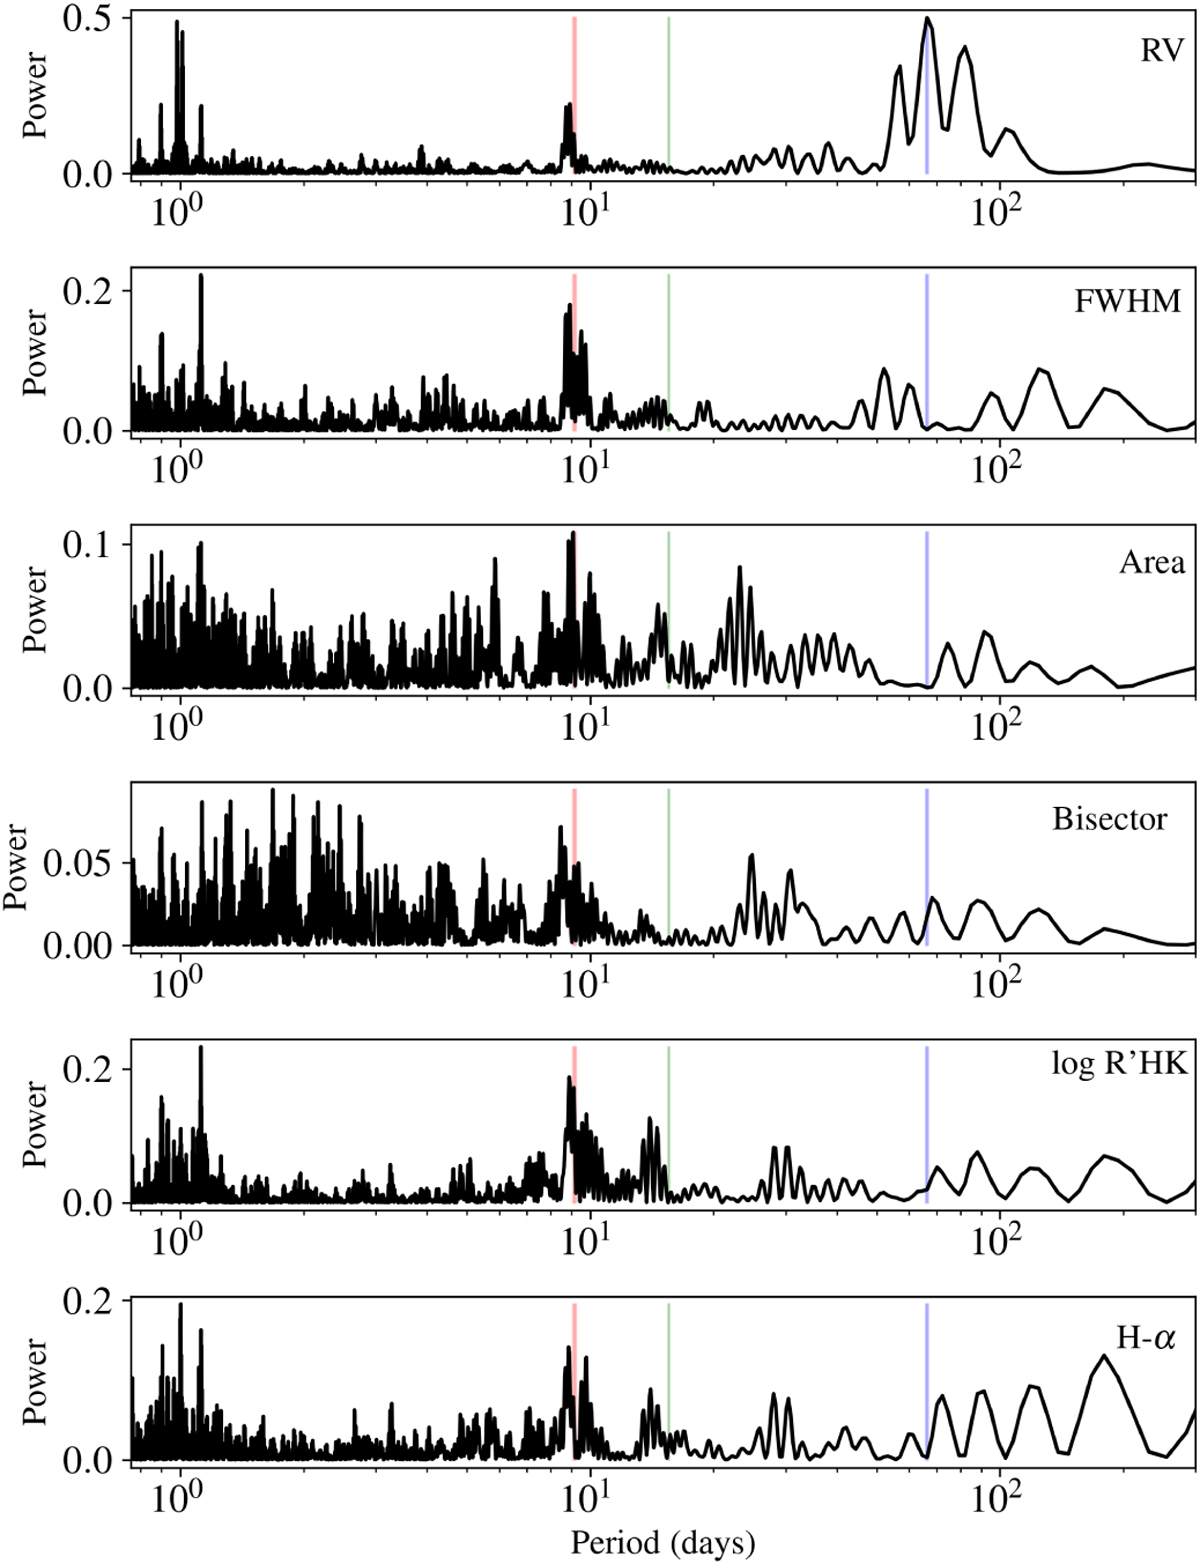
Generalized Lomb-Scargle periodograms for RV and activity indicators. GLSP are calculated on the basis of binned SOPHIE data, where we have eliminated long-term variation using a two-degree polynomial fit. From top to bottom, we show the GLSP for the RV, FWHM, the Area of the Gaussian fit to the CCF, Bisector, ![]() , and Hα lines. The red, green, and blue vertical lines indicate the stellar rotation period, the orbital period of the transiting planet (b), and the orbital period of the candidate planet (c), respectively.
, and Hα lines. The red, green, and blue vertical lines indicate the stellar rotation period, the orbital period of the transiting planet (b), and the orbital period of the candidate planet (c), respectively.
Current usage metrics show cumulative count of Article Views (full-text article views including HTML views, PDF and ePub downloads, according to the available data) and Abstracts Views on Vision4Press platform.
Data correspond to usage on the plateform after 2015. The current usage metrics is available 48-96 hours after online publication and is updated daily on week days.
Initial download of the metrics may take a while.