Fig. 4
Download original image
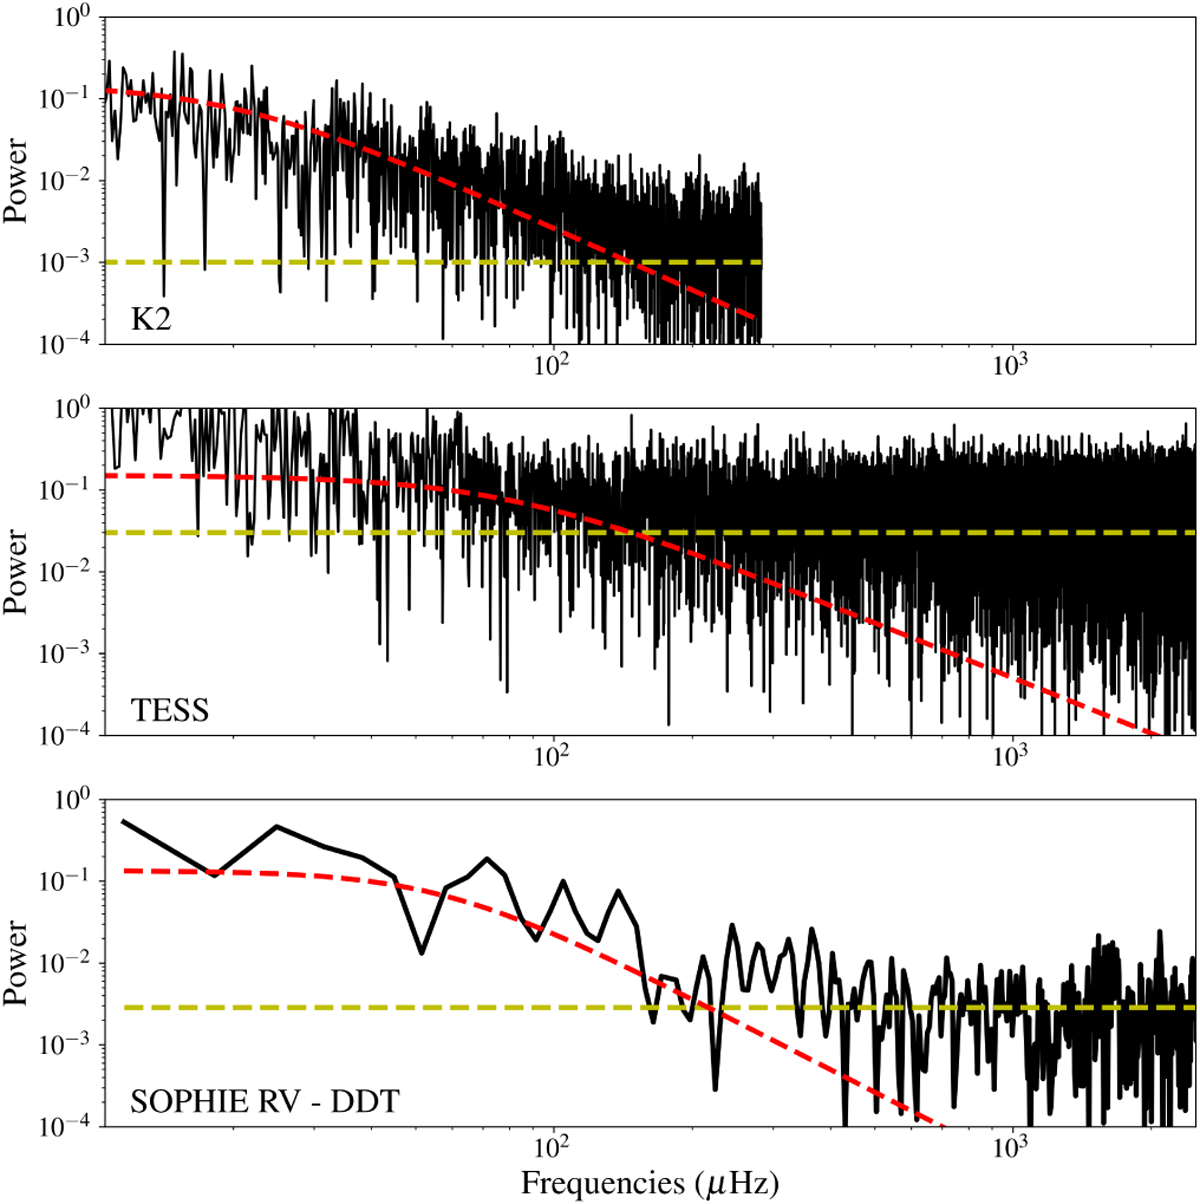
Generalized Lomb-Scargle periodograms of K2, TESS, and SOPHIE RV data for periods of less than one day. The axes are presented in a log-scale format. The yellow and red dashed curves represent best Harvey-function fits to the periodograms, helping for a visual representation of both white Gaussian noise (WGN) and short-term stellar variability.
Current usage metrics show cumulative count of Article Views (full-text article views including HTML views, PDF and ePub downloads, according to the available data) and Abstracts Views on Vision4Press platform.
Data correspond to usage on the plateform after 2015. The current usage metrics is available 48-96 hours after online publication and is updated daily on week days.
Initial download of the metrics may take a while.