Fig. C.2
Download original image
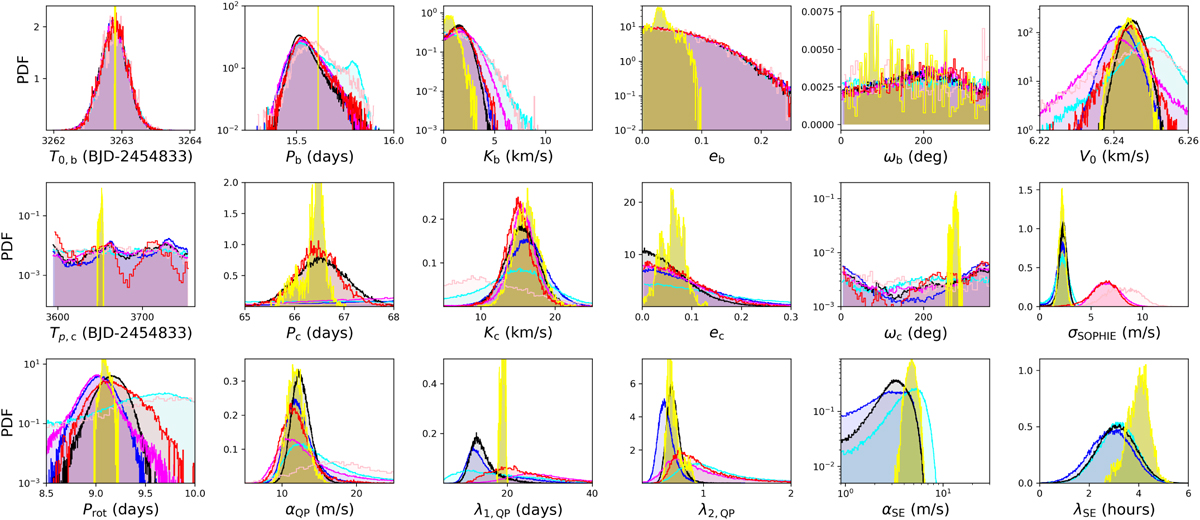
Normalized posteriors distribution of the parameters fitted to the RV data. The distributions resulting from the analyses of the SOPHIE binned observations are shown in magenta (C1), pink (C2), and red (C1+C2). The distributions corresponding to the analyses of the unbinned data are shown in blue (C1), cyan (C2), and black (C1+C2). The distributions resulting from the joint analysis combining the photometric (K2+TESS) and nonbinned RV (SOPHIE+HIRES) observations are shown in yellow (benchmark). Top: the five Keplerian parameters of planet b (T0,b, Pb, Kb, eb, ωb), and V0. Middle: the five Keplerian parameters of the candidate planet (T0,c, Pc, Kc, ec, ωc), and the RV jitter (σSOPHIE). Bottom: the GP hyperparameters of the stellar magnetic activity model (Prot, αQP, λ1,QP, λ2,QP), and the short-term stellar noise model (αSE,/λSE).
Current usage metrics show cumulative count of Article Views (full-text article views including HTML views, PDF and ePub downloads, according to the available data) and Abstracts Views on Vision4Press platform.
Data correspond to usage on the plateform after 2015. The current usage metrics is available 48-96 hours after online publication and is updated daily on week days.
Initial download of the metrics may take a while.