Fig. C.1
Download original image
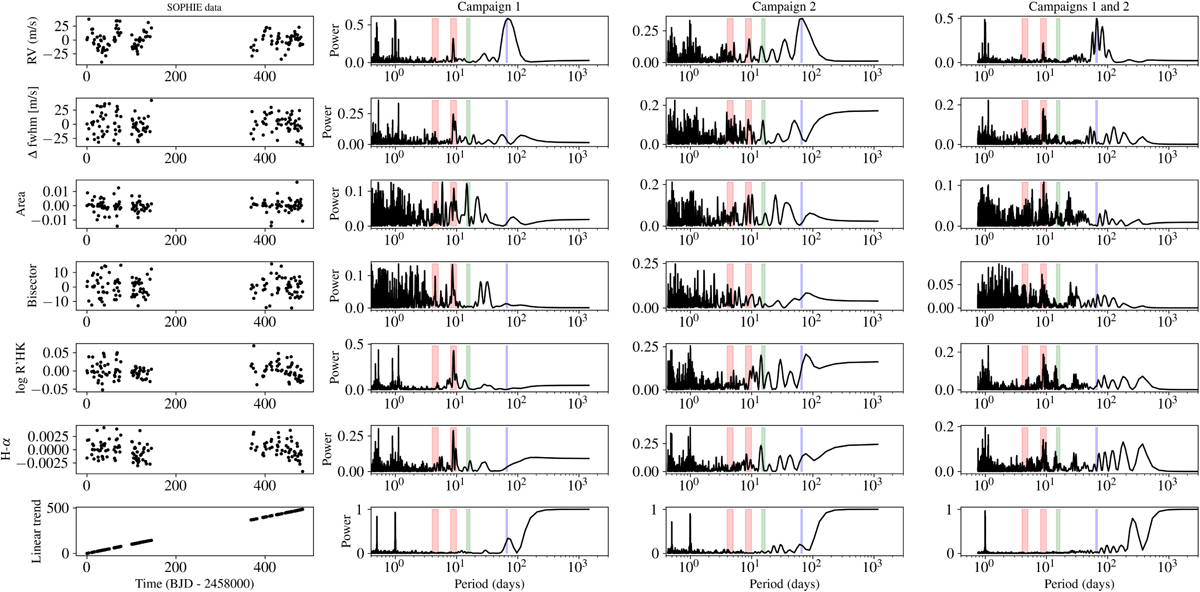
Temporal evolution of the stellar activity. From top to bottom: RV data, FWHM, the Area of the Gaussian fit to the CCF, Bisector, ![]() Hα lines, and linear trend. From left to right: Time series, GLSP for first campaign, second campaign and both campaigns. In all time series, we have eliminated long-term variation by a two-degree polynomial fit. The large red, green and blue vertical lines indicate the stellar rotation period (and half its period), the orbital period of the transiting planet (b), and the orbital period of the candidate planet (c), respectively.
Hα lines, and linear trend. From left to right: Time series, GLSP for first campaign, second campaign and both campaigns. In all time series, we have eliminated long-term variation by a two-degree polynomial fit. The large red, green and blue vertical lines indicate the stellar rotation period (and half its period), the orbital period of the transiting planet (b), and the orbital period of the candidate planet (c), respectively.
Current usage metrics show cumulative count of Article Views (full-text article views including HTML views, PDF and ePub downloads, according to the available data) and Abstracts Views on Vision4Press platform.
Data correspond to usage on the plateform after 2015. The current usage metrics is available 48-96 hours after online publication and is updated daily on week days.
Initial download of the metrics may take a while.