Fig. 7
Download original image
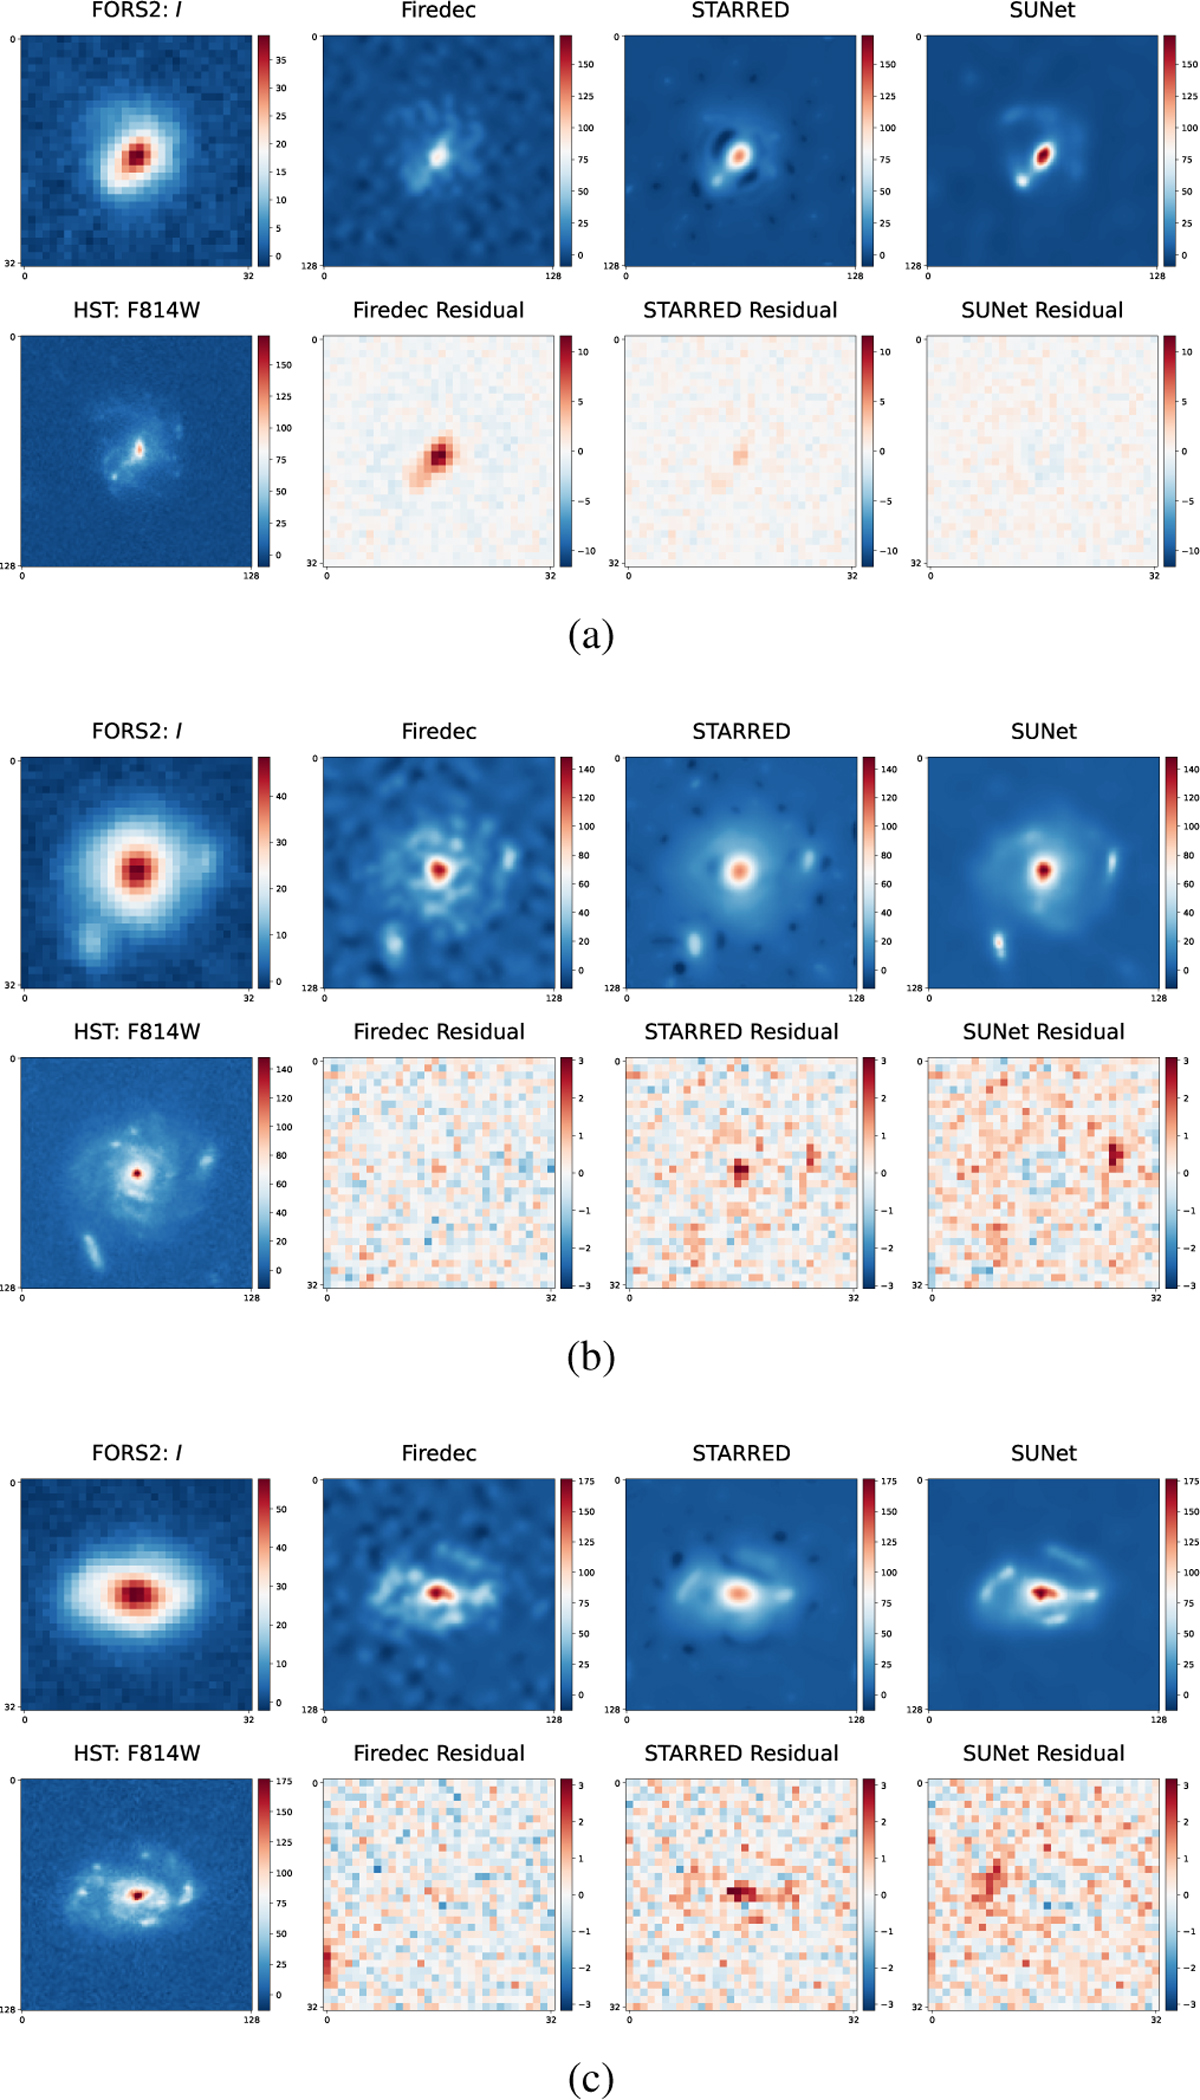
Visual comparison between the deconvolved outputs. The FORS2 image in the I-band is displayed in the top-left corner, with the HST image in the F814W filter directly below it. The Firedec, STARRED, and SUNet images in the I-band are shown in the second, third, and fourth columns of the first row, respectively. Beneath each output, the corresponding residual is depicted, which is defined as follows: residual = noisy VLT image – PSF * deconvolved image.
Current usage metrics show cumulative count of Article Views (full-text article views including HTML views, PDF and ePub downloads, according to the available data) and Abstracts Views on Vision4Press platform.
Data correspond to usage on the plateform after 2015. The current usage metrics is available 48-96 hours after online publication and is updated daily on week days.
Initial download of the metrics may take a while.