Fig. A.1
Download original image
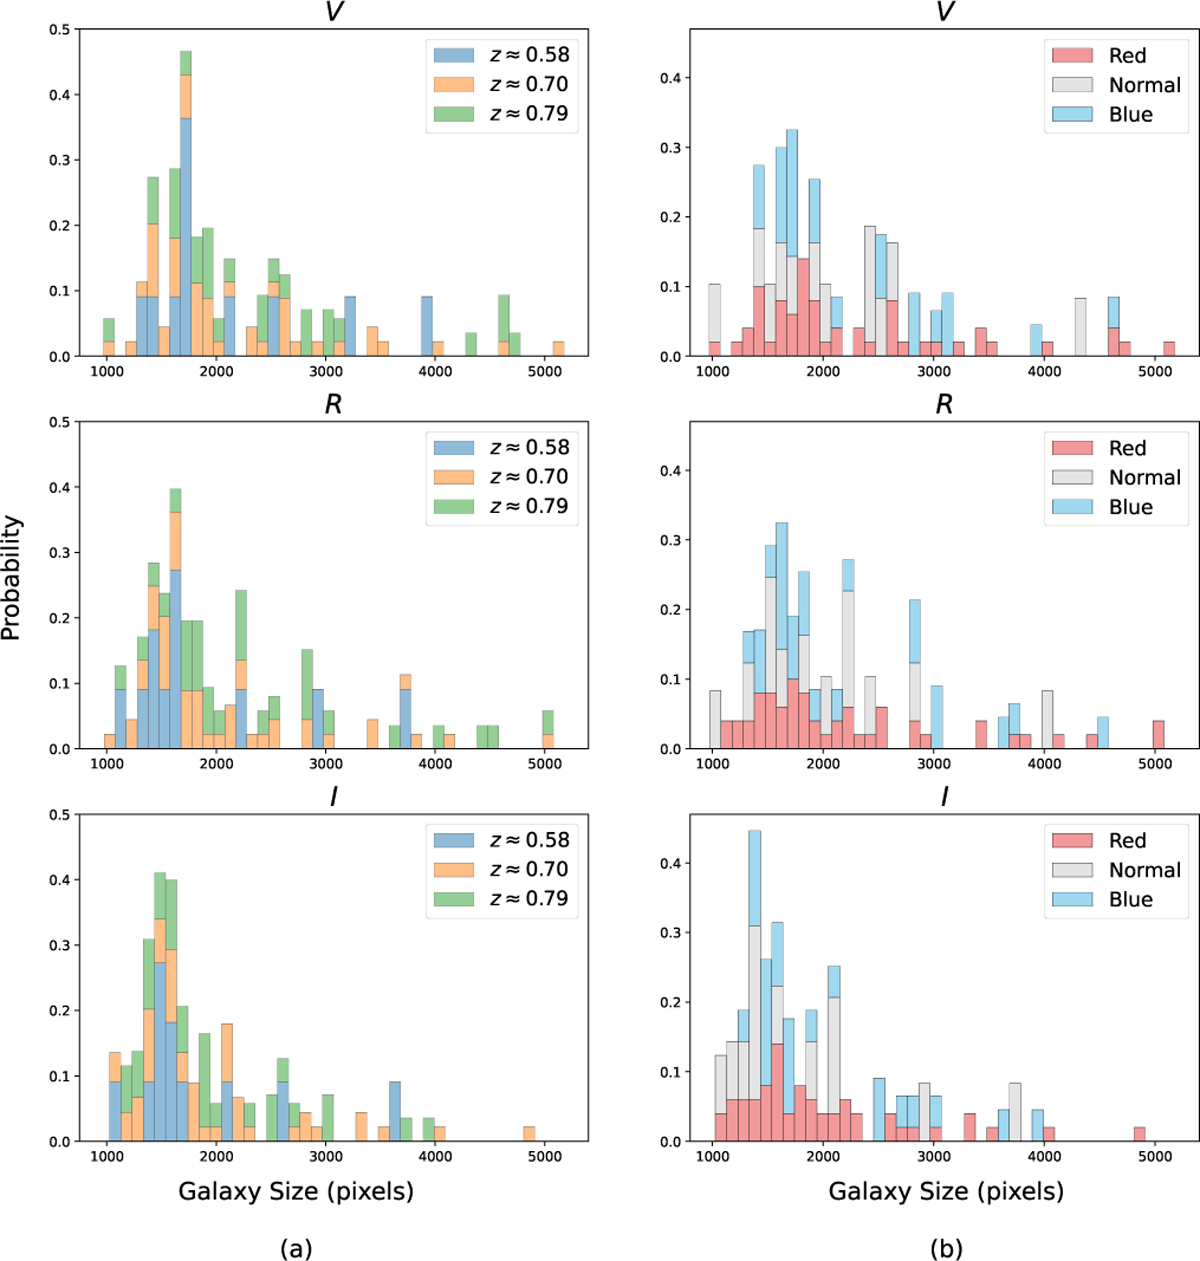
Validity check to ensure that the properties of our sample galaxies remain unaffected by size biases, (a): Histogram of galaxy sizes in the V-, R-, and I-bands grouped by their parent cluster redshift: ɀ ≈ 0.58, ɀ ≈ 0.70, ɀ ≈ 0.79. Each coloured bar in the plot represents a specific redshift value, with bars of different redshiſts stacked on top of each other, (b): Histogram of galaxy sizes in the V-, R-, and I-bands grouped by their disc colour. Galaxies are classified as ‘Red’ if they are redder, ‘Normal’ if they are comparable, and ‘Blue’ if they are bluer than the field members. Each coloured bar in the plot represents a disc colour category, with bars of different disc colours stacked on top of each other.
Current usage metrics show cumulative count of Article Views (full-text article views including HTML views, PDF and ePub downloads, according to the available data) and Abstracts Views on Vision4Press platform.
Data correspond to usage on the plateform after 2015. The current usage metrics is available 48-96 hours after online publication and is updated daily on week days.
Initial download of the metrics may take a while.