Open Access
Fig. A.1
Download original image
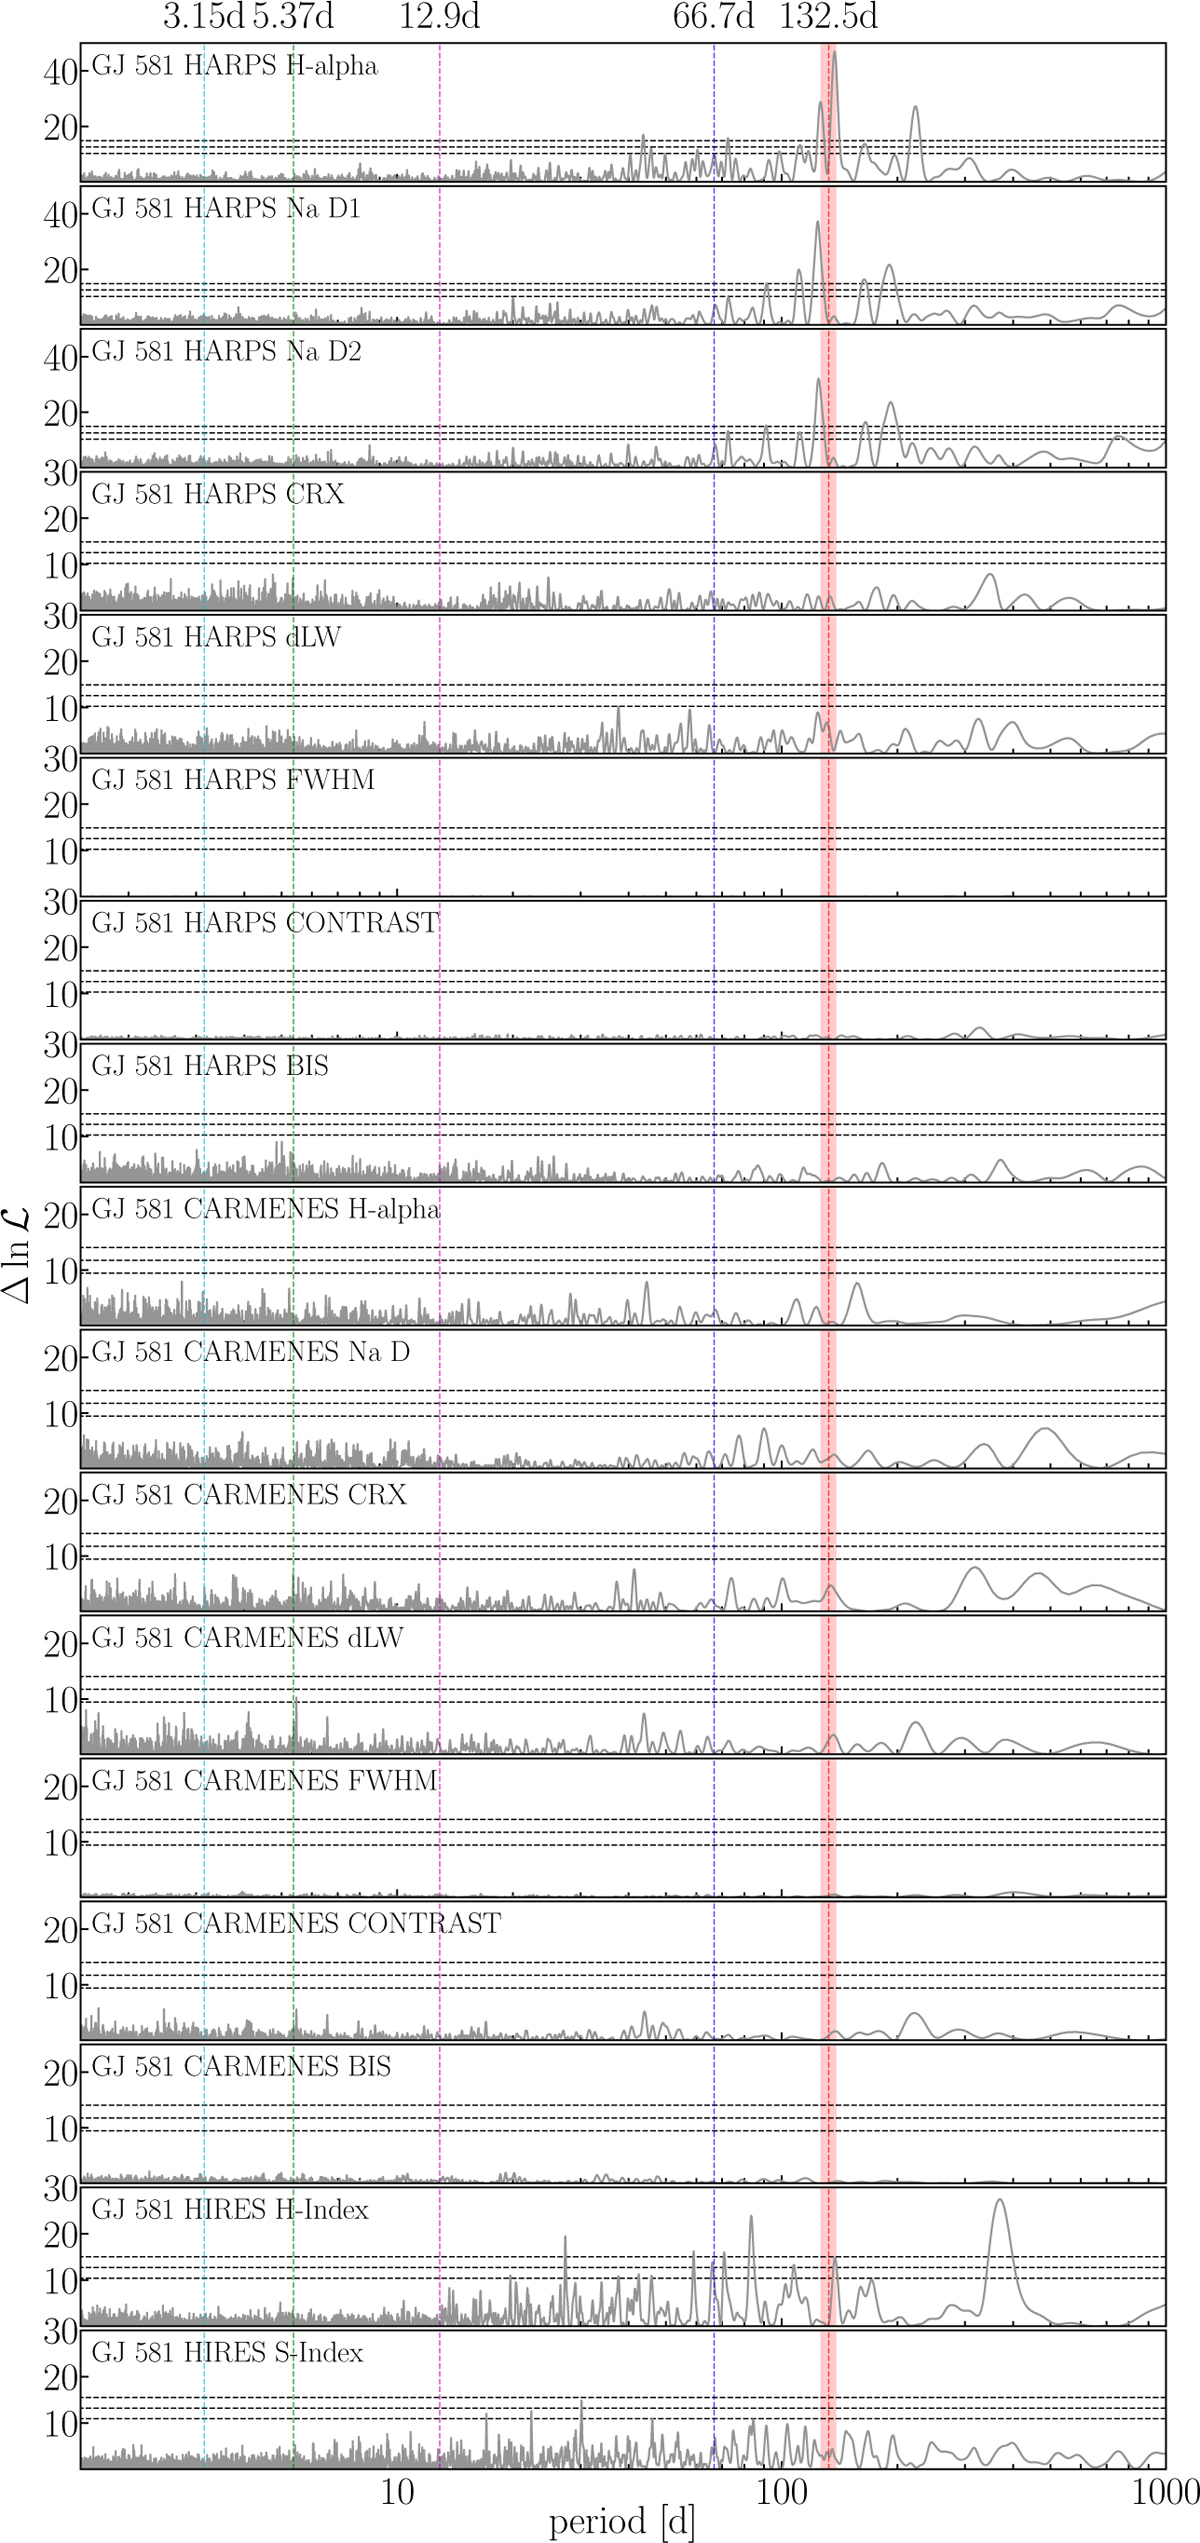
Full MLP power spectrum for all RV time series used, as well as their respective activity time series. Horizontal dashed lines indicate FAP levels of 10%, 1%, and 0.1%. The cyan, green, magenta, and blue vertical lines indicate the period of GJ 581 e, GJ 581 b, GJ 581 c and the 66.7 d signal, respectively.
Current usage metrics show cumulative count of Article Views (full-text article views including HTML views, PDF and ePub downloads, according to the available data) and Abstracts Views on Vision4Press platform.
Data correspond to usage on the plateform after 2015. The current usage metrics is available 48-96 hours after online publication and is updated daily on week days.
Initial download of the metrics may take a while.