Fig. 1
Download original image
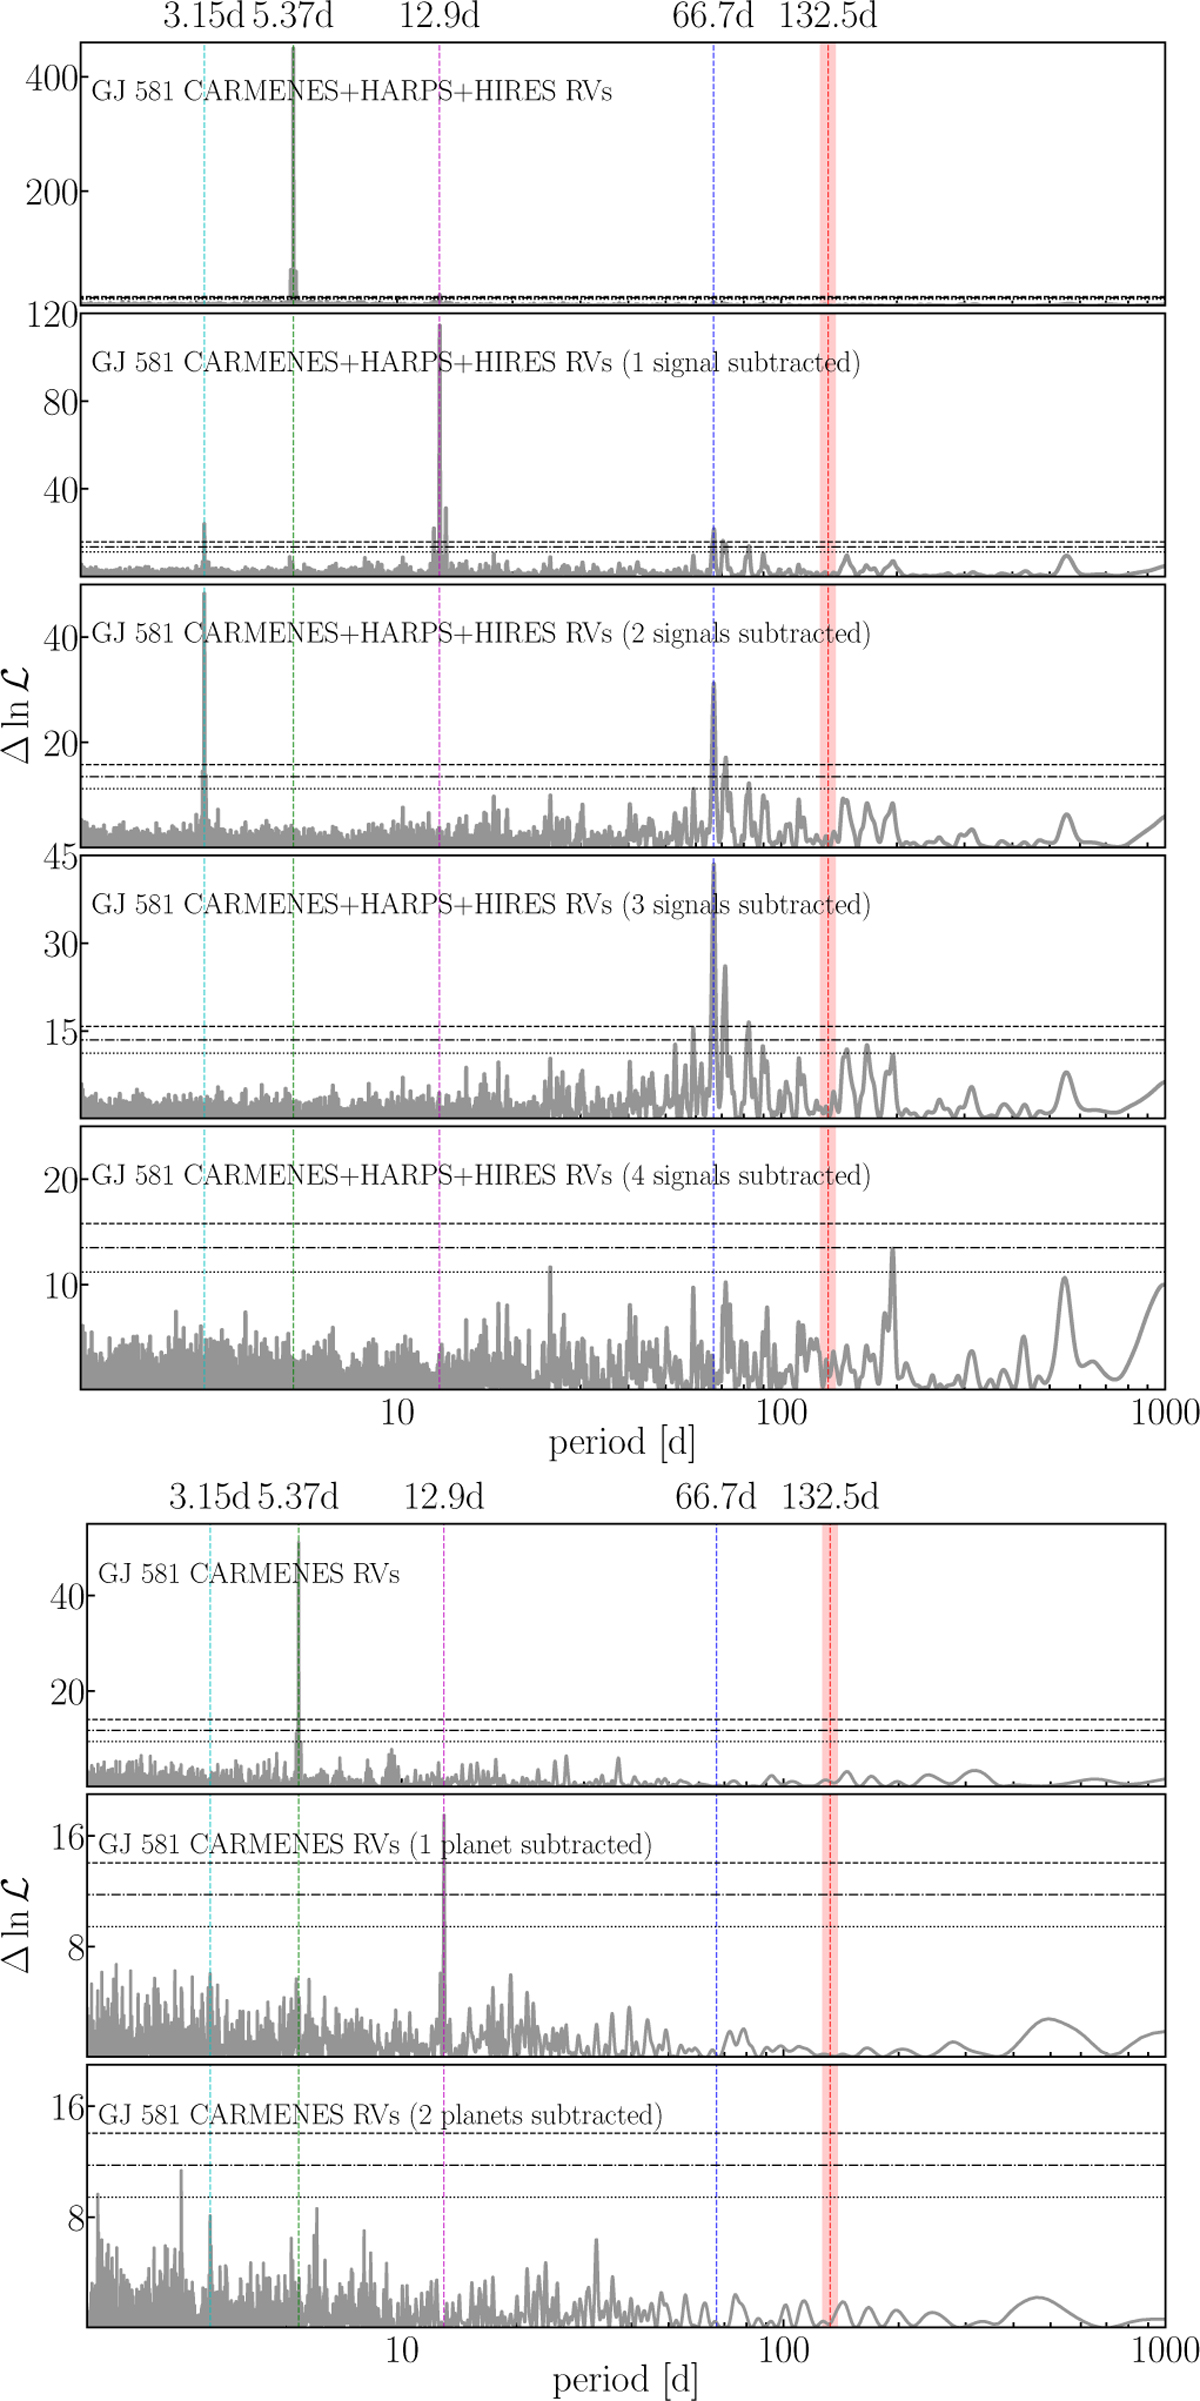
MLP power spectrum of RV data. Top panels: HIRES, HARPS, and CARMENES. Bottom panels: CARMENES only. Horizontal dashed lines indicate FAP levels of 10%, 1%, and 0.1%, as defined by Zechmeister & Kürster (2009). The cyan, green, magenta, and blue vertical lines indicate the orbital periods of GJ 581 e, GJ 581 b, GJ 581 c, and of the conjectural GJ 581 [d], respectively. The red vertical line represents the rotational period of GI 581 (Prot = 132.5 ± 6.3 days), with shaded regions indicating the associated uncertainty range (see Table 1).
Current usage metrics show cumulative count of Article Views (full-text article views including HTML views, PDF and ePub downloads, according to the available data) and Abstracts Views on Vision4Press platform.
Data correspond to usage on the plateform after 2015. The current usage metrics is available 48-96 hours after online publication and is updated daily on week days.
Initial download of the metrics may take a while.