Open Access
Fig. 3
Download original image
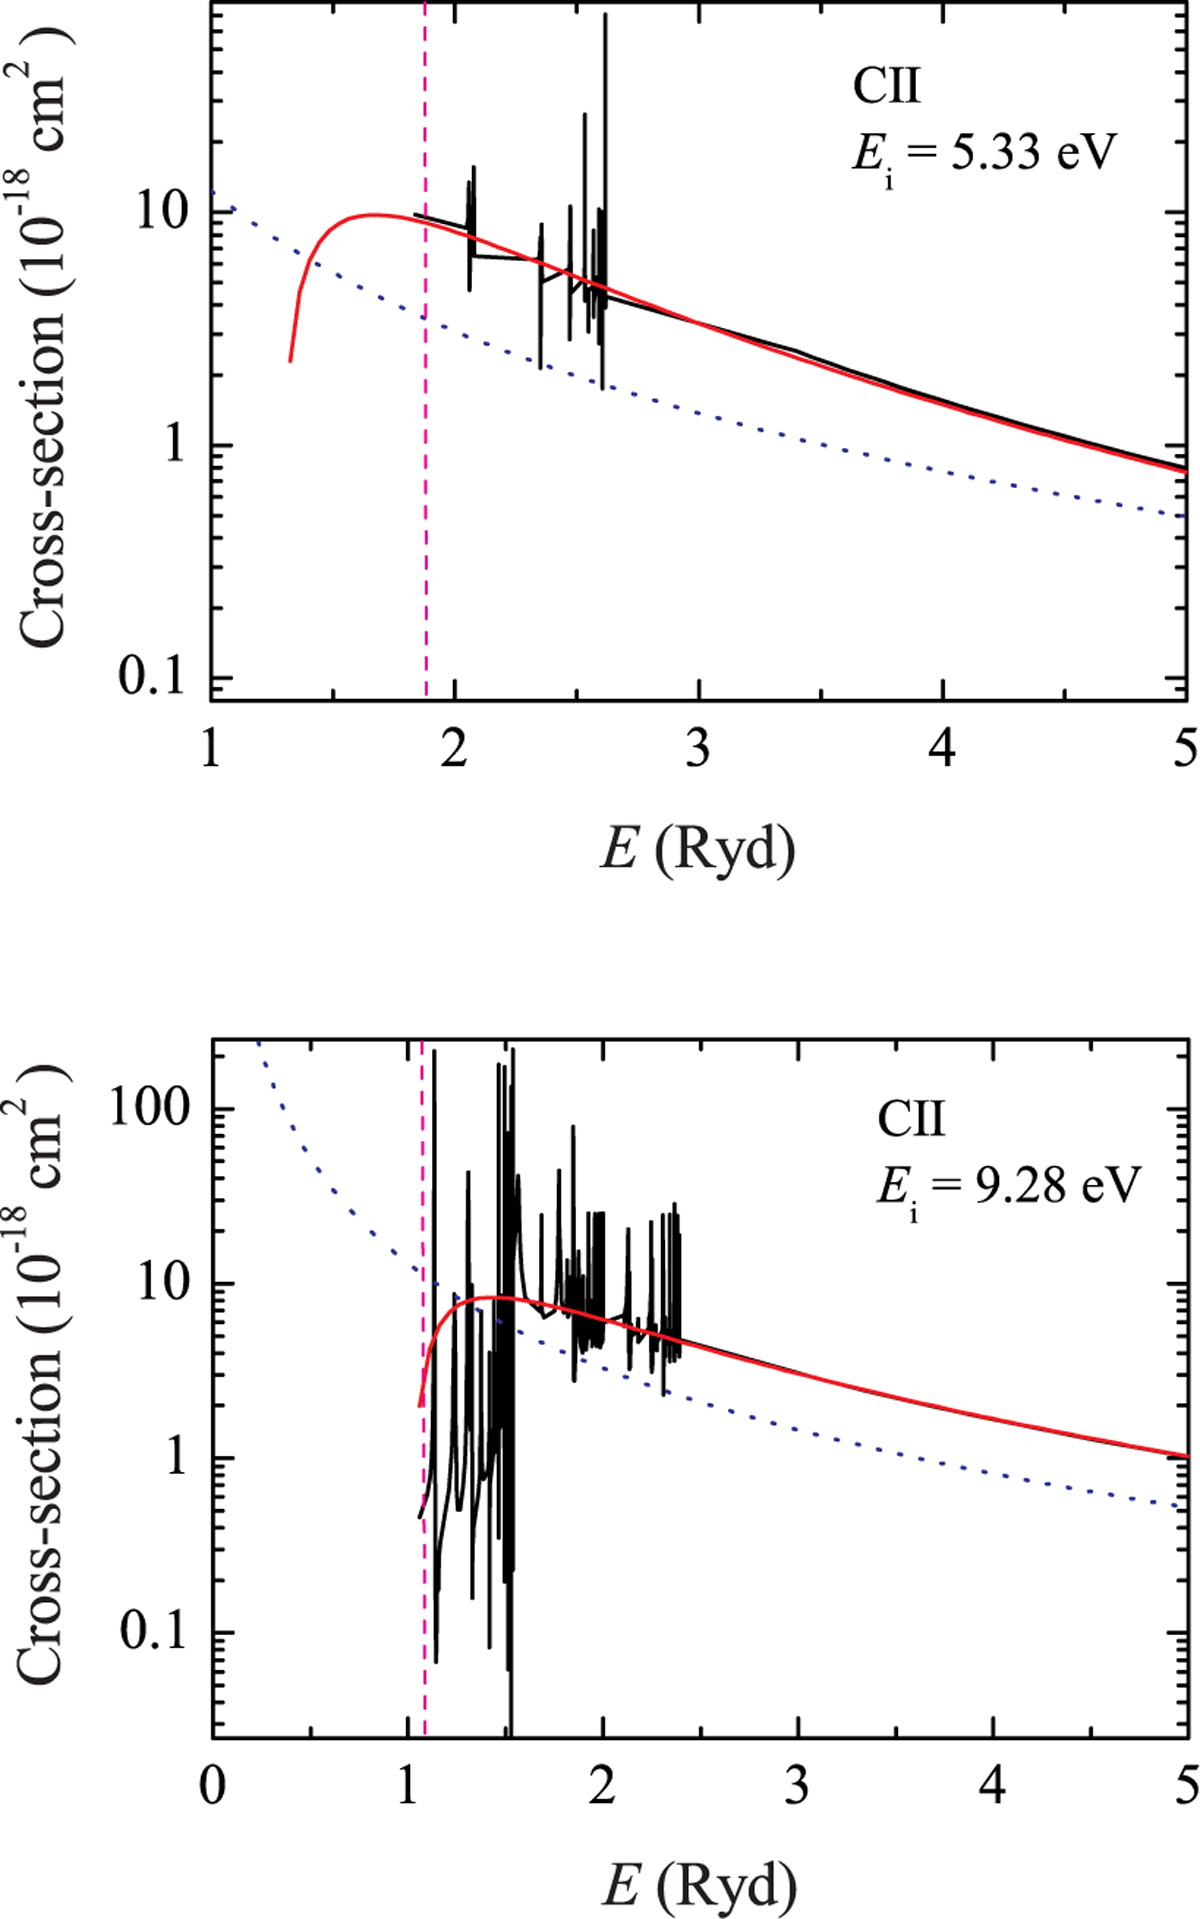
Comparison of the photoionization cross-sections from two excited levels of C II. Cross-sections computed by OP (solid black curves), the approximation used in ATLAS9 (dashed blue curves), and our fits (red curves). Vertical dashed lines correspond to the ionization thresholds.
Current usage metrics show cumulative count of Article Views (full-text article views including HTML views, PDF and ePub downloads, according to the available data) and Abstracts Views on Vision4Press platform.
Data correspond to usage on the plateform after 2015. The current usage metrics is available 48-96 hours after online publication and is updated daily on week days.
Initial download of the metrics may take a while.