Fig. 14
Download original image
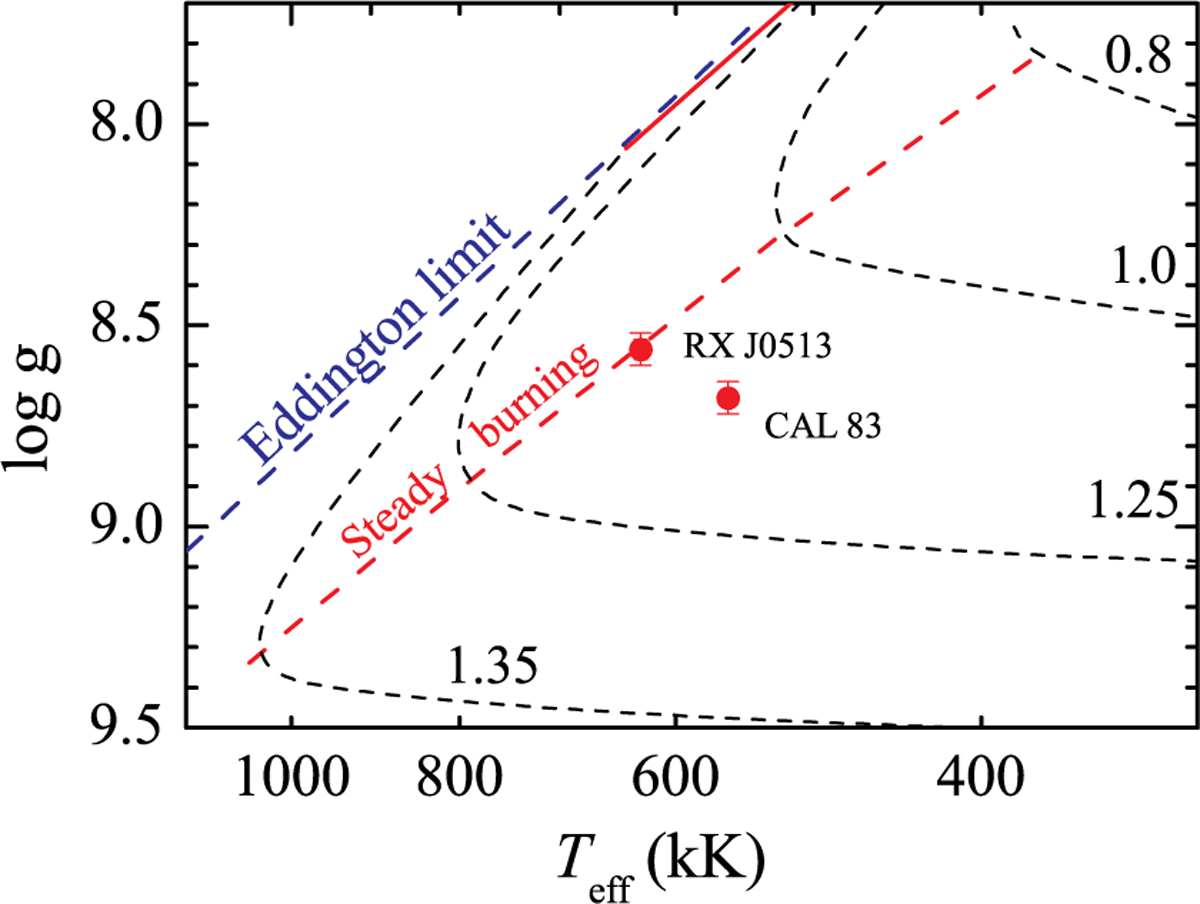
Positions of the investigated SSSs in the Teff-log g plane. Model dependencies for various WD masses (Nomoto et al. 2007) are shown by black dashed curves with indicated WD masses (in solar masses). The boundaries of the stable thermonuclear burning band are shown by the solid (upper boundary) and the dashed (lower boundary) red lines. The Eddington limit for solar H/He abundances is shown by the blue dashed line.
Current usage metrics show cumulative count of Article Views (full-text article views including HTML views, PDF and ePub downloads, according to the available data) and Abstracts Views on Vision4Press platform.
Data correspond to usage on the plateform after 2015. The current usage metrics is available 48-96 hours after online publication and is updated daily on week days.
Initial download of the metrics may take a while.