Fig. 11
Download original image
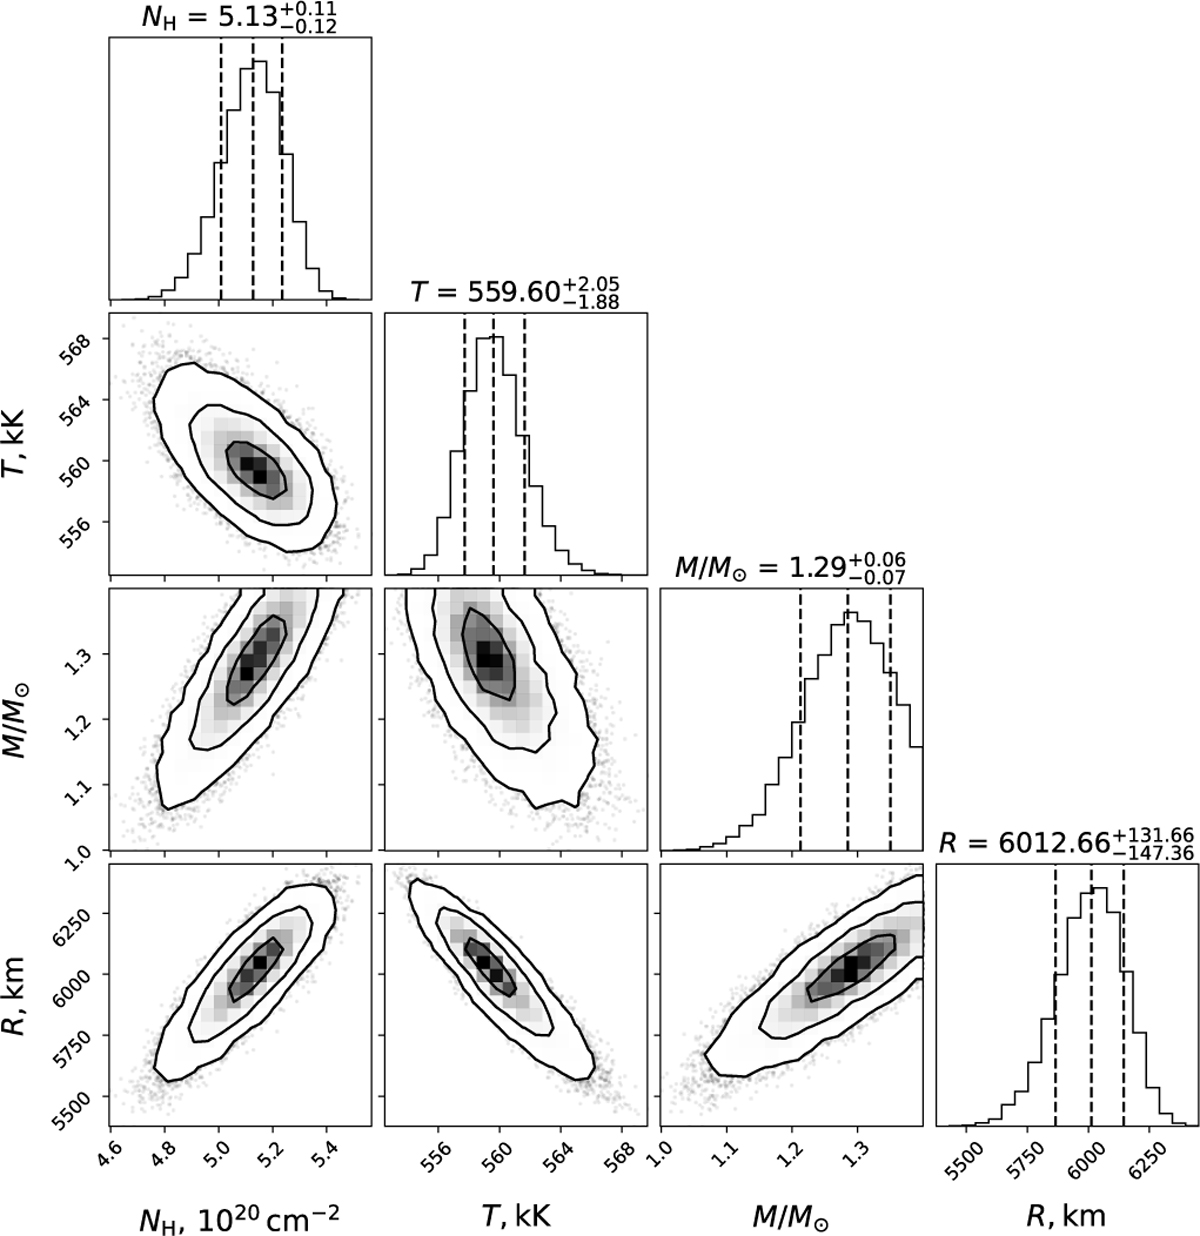
Corner plot of the posterior distribution for parameters of CAL 83. The 2D contours correspond to 39.3%, 86.5%, and 98.9% confidence levels. The histograms show the normalized 1D distributions for a given parameter derived from the posterior samples. The best-fit parameter values are presented in Table 2. A Gaussian prior for the hydrogen column density NH was used, with μ = 6.5 × 1020 cm−2 and σ = 1.0 × 1020 cm−2.
Current usage metrics show cumulative count of Article Views (full-text article views including HTML views, PDF and ePub downloads, according to the available data) and Abstracts Views on Vision4Press platform.
Data correspond to usage on the plateform after 2015. The current usage metrics is available 48-96 hours after online publication and is updated daily on week days.
Initial download of the metrics may take a while.