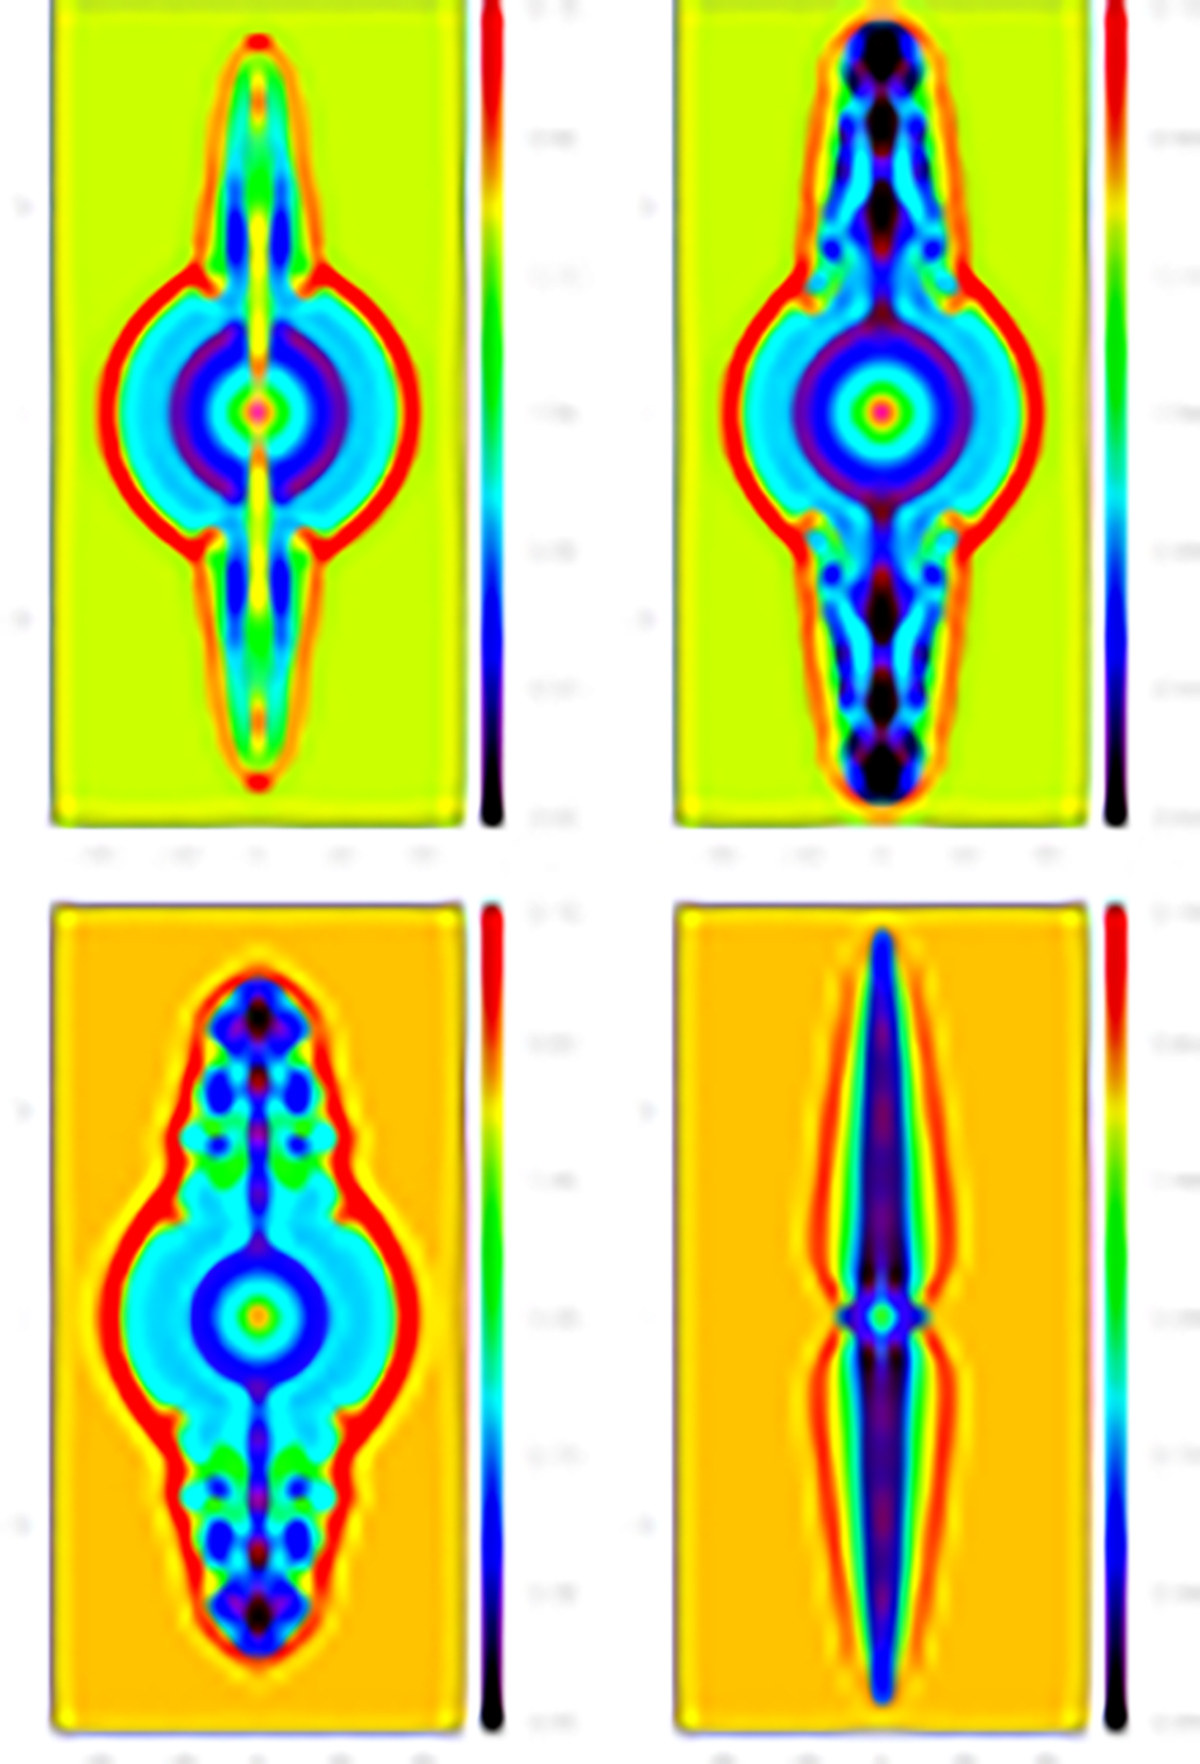
Fig. A.1.
Download original image
Density slices for different wind configurations. The color corresponds to log10(ρ), where ρ is in units of mp/cm3, and the color-coding is different for the top and bottom rows. The top two panels use the same parameters of the i-wind, Li = 1039 erg s−1, v = 2 × 10³ km s−1, but different initial p-wind densities and velocities. In the left panel, the p-wind velocity is the same as in the i-wind, but the density is 60 times higher, and in the right panel, the density is the same as in the i-wind, but the velocity is higher by a factor of 6, i.e., ∼1.2 × 10⁴ km s−1. The bottom left panel shows a simulation for twice higher i- and p-wind velocities, 4 × 10³ km s−1 and ∼2.4 × 10⁴ km s−1, respectively. Finally, the bottom right panel shows the case when the i-wind is much weaker than in the bottom left panel. In this case, the jet behavior follows a self-similar solution, when the underdense jet is recollimated by its cocoon. In all simulations, the half-opening angle of the p-wind was the same, ∼4 − 5°
Current usage metrics show cumulative count of Article Views (full-text article views including HTML views, PDF and ePub downloads, according to the available data) and Abstracts Views on Vision4Press platform.
Data correspond to usage on the plateform after 2015. The current usage metrics is available 48-96 hours after online publication and is updated daily on week days.
Initial download of the metrics may take a while.