Open Access
Fig. 5
Download original image
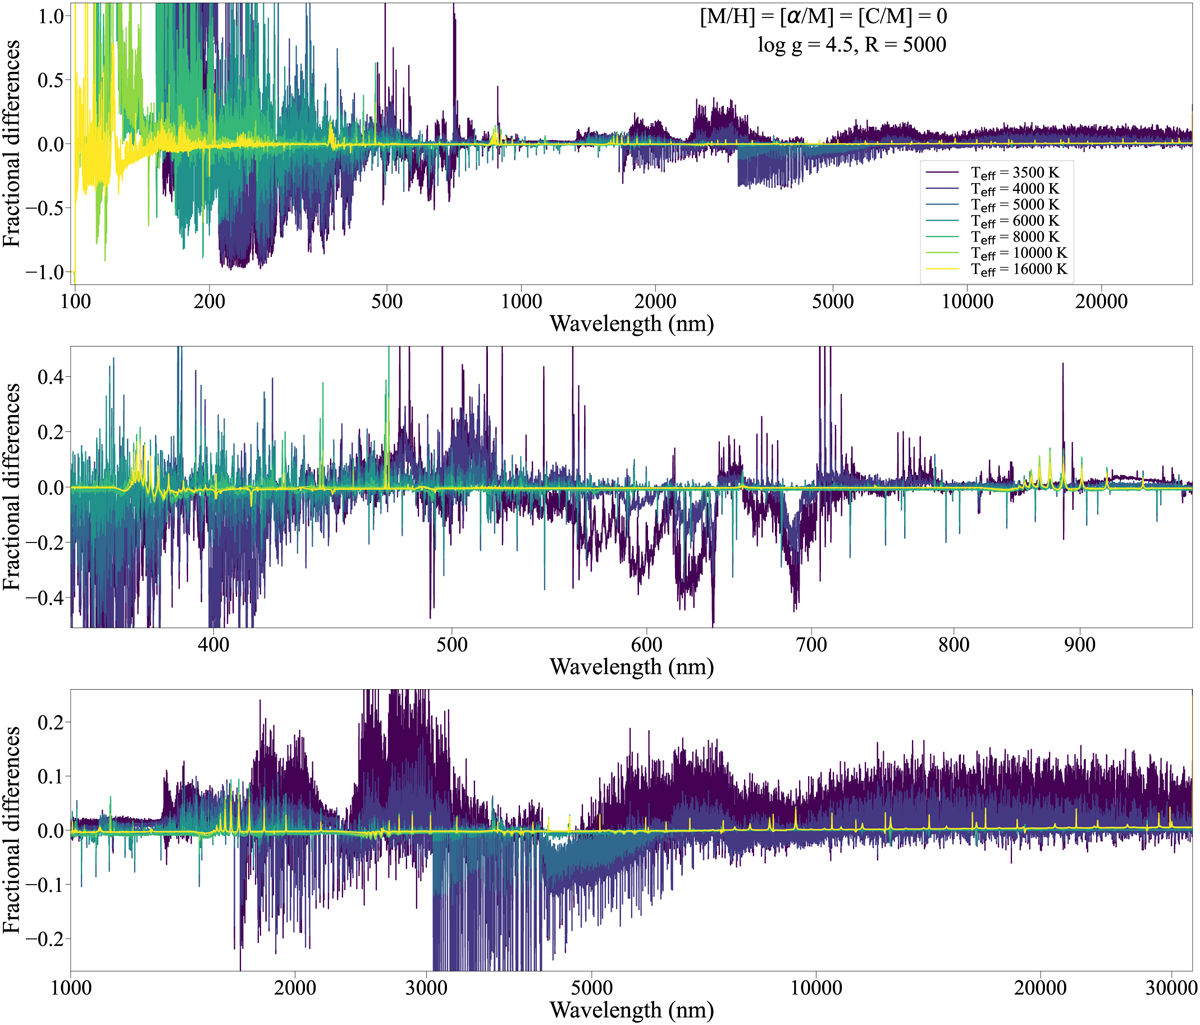
Fractional differences between the flux of the new and old BOSZ grid relative to the old grid. Top panel: showing the full spectral range between 100 nm and 32 µm. Middle panel: relative differences in the optical range. Bottom panel: relative differences in the IR.
Current usage metrics show cumulative count of Article Views (full-text article views including HTML views, PDF and ePub downloads, according to the available data) and Abstracts Views on Vision4Press platform.
Data correspond to usage on the plateform after 2015. The current usage metrics is available 48-96 hours after online publication and is updated daily on week days.
Initial download of the metrics may take a while.