Fig. 4
Download original image
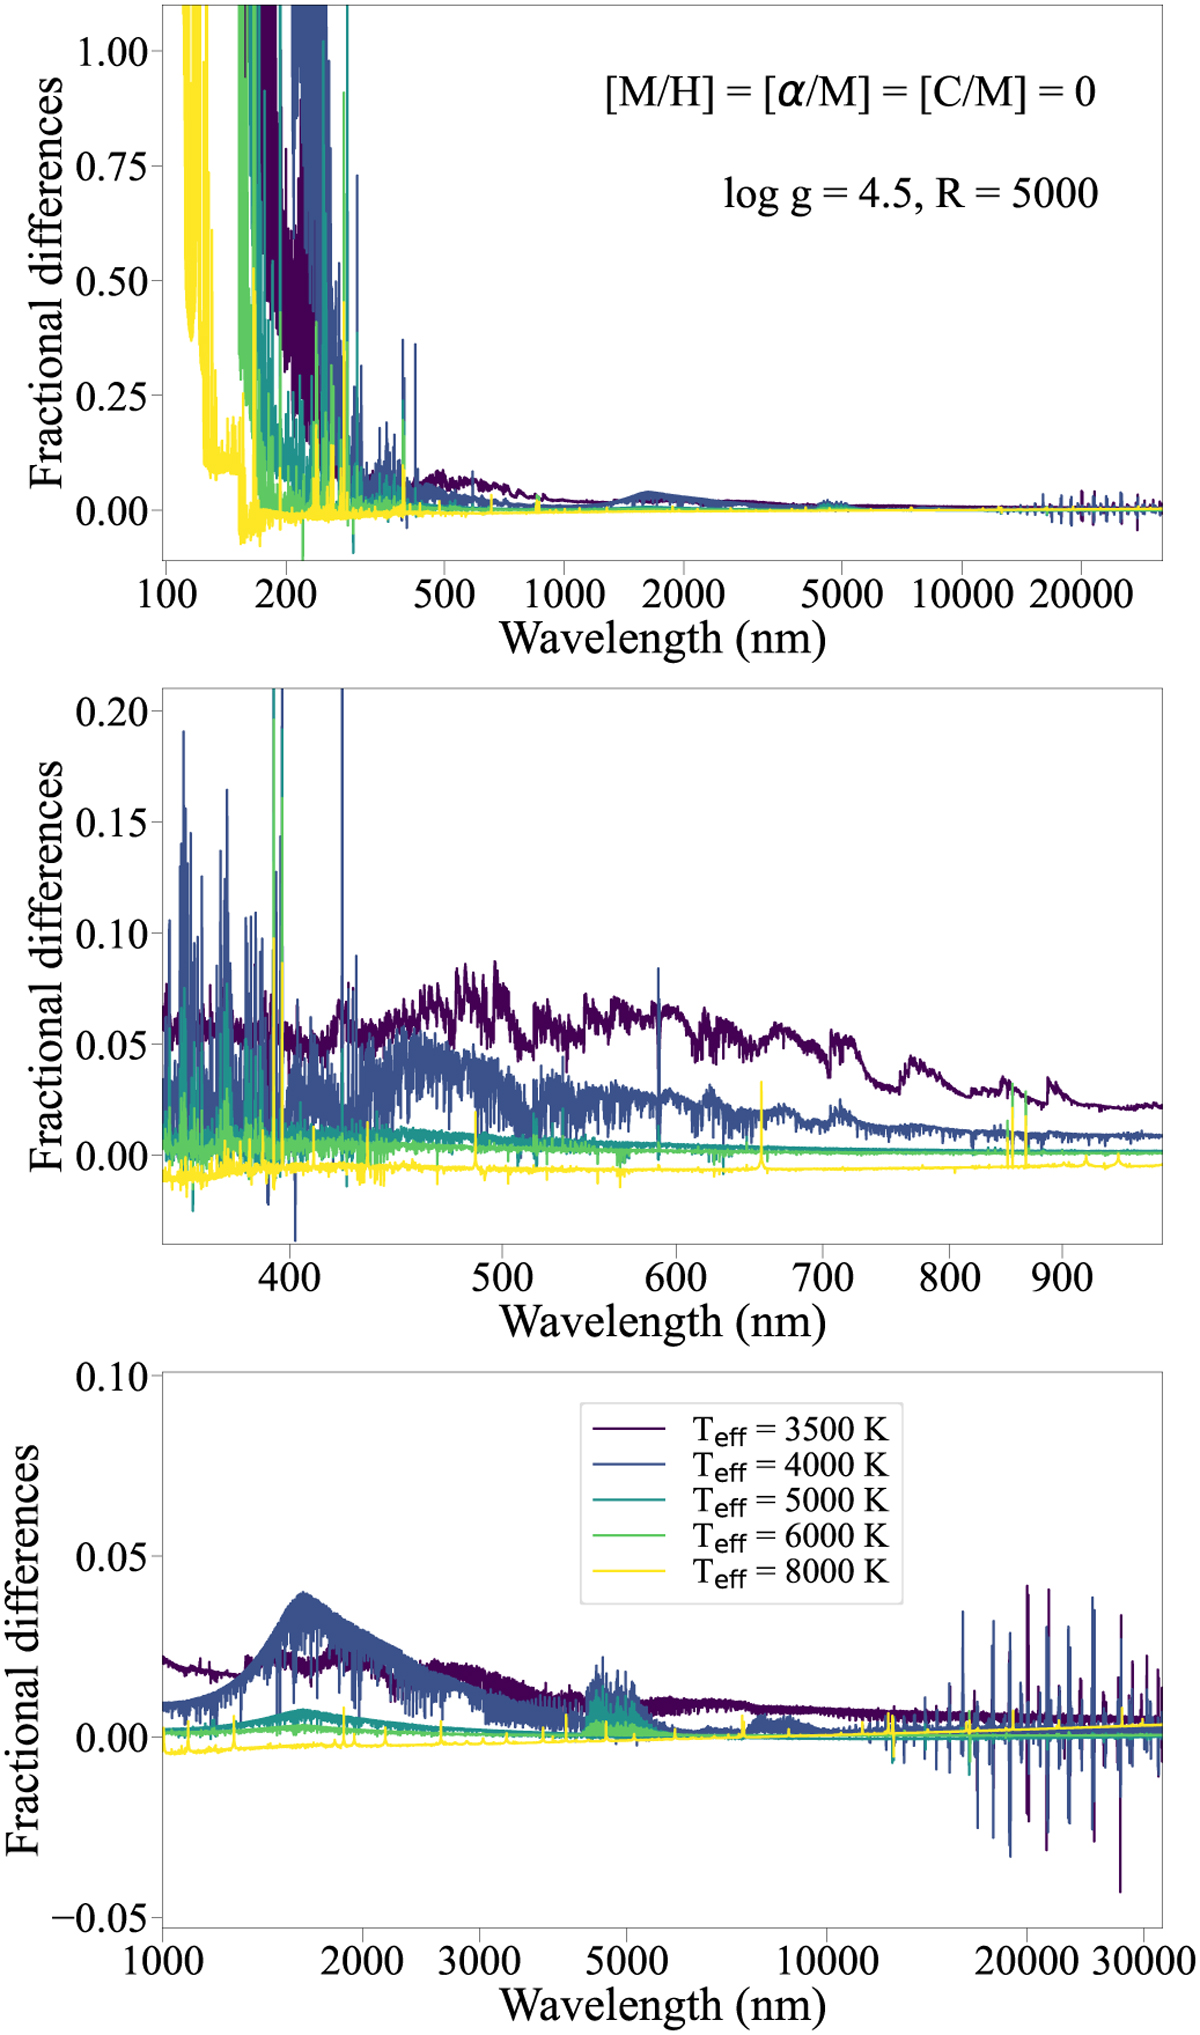
Fractional differences between MARCS and ATLAS9 flux relative to the ATLAS9 flux. Top panel: spectra shown from Teff = 3500 K to 8000 K and between 100 nm and 32 µm. A large discrepancy exists in the UV for all temperatures. Middle panel: relative differences in the optical and near-IR, where the offset is usually within 10%. Bottom panel: relative differences are the smallest in the IR between 1 and 32 µm. The large spikes above 15 µm originate from slight spectral mismatches in the resampling.
Current usage metrics show cumulative count of Article Views (full-text article views including HTML views, PDF and ePub downloads, according to the available data) and Abstracts Views on Vision4Press platform.
Data correspond to usage on the plateform after 2015. The current usage metrics is available 48-96 hours after online publication and is updated daily on week days.
Initial download of the metrics may take a while.