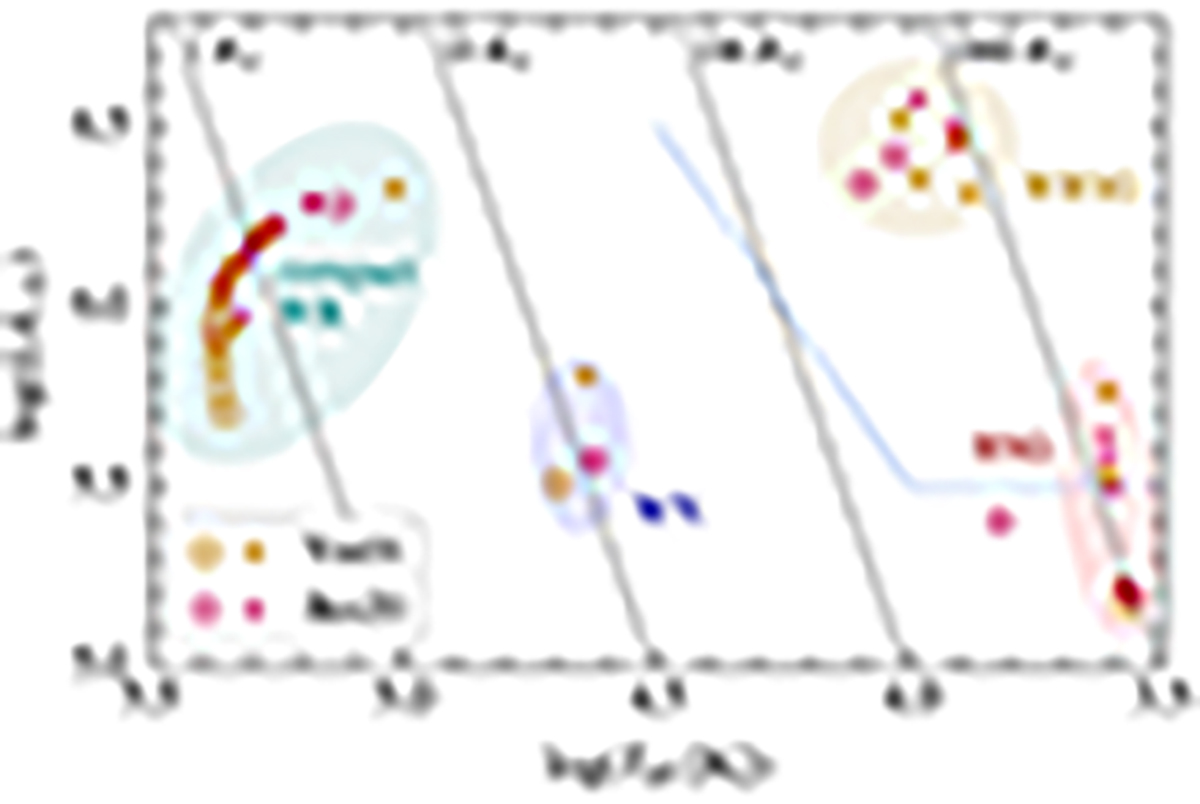
Fig. 8.
Download original image
HRD showing the evolutionary endpoints of the models that were computed until the end of core carbon burning at solar metallicity (large markers) and LMC metallicity (small markers). The labeled ellipses show different populations of SN progenitors. Dashed black lines show equal radius of several different values. The blue line indicates the HD limit.
Current usage metrics show cumulative count of Article Views (full-text article views including HTML views, PDF and ePub downloads, according to the available data) and Abstracts Views on Vision4Press platform.
Data correspond to usage on the plateform after 2015. The current usage metrics is available 48-96 hours after online publication and is updated daily on week days.
Initial download of the metrics may take a while.