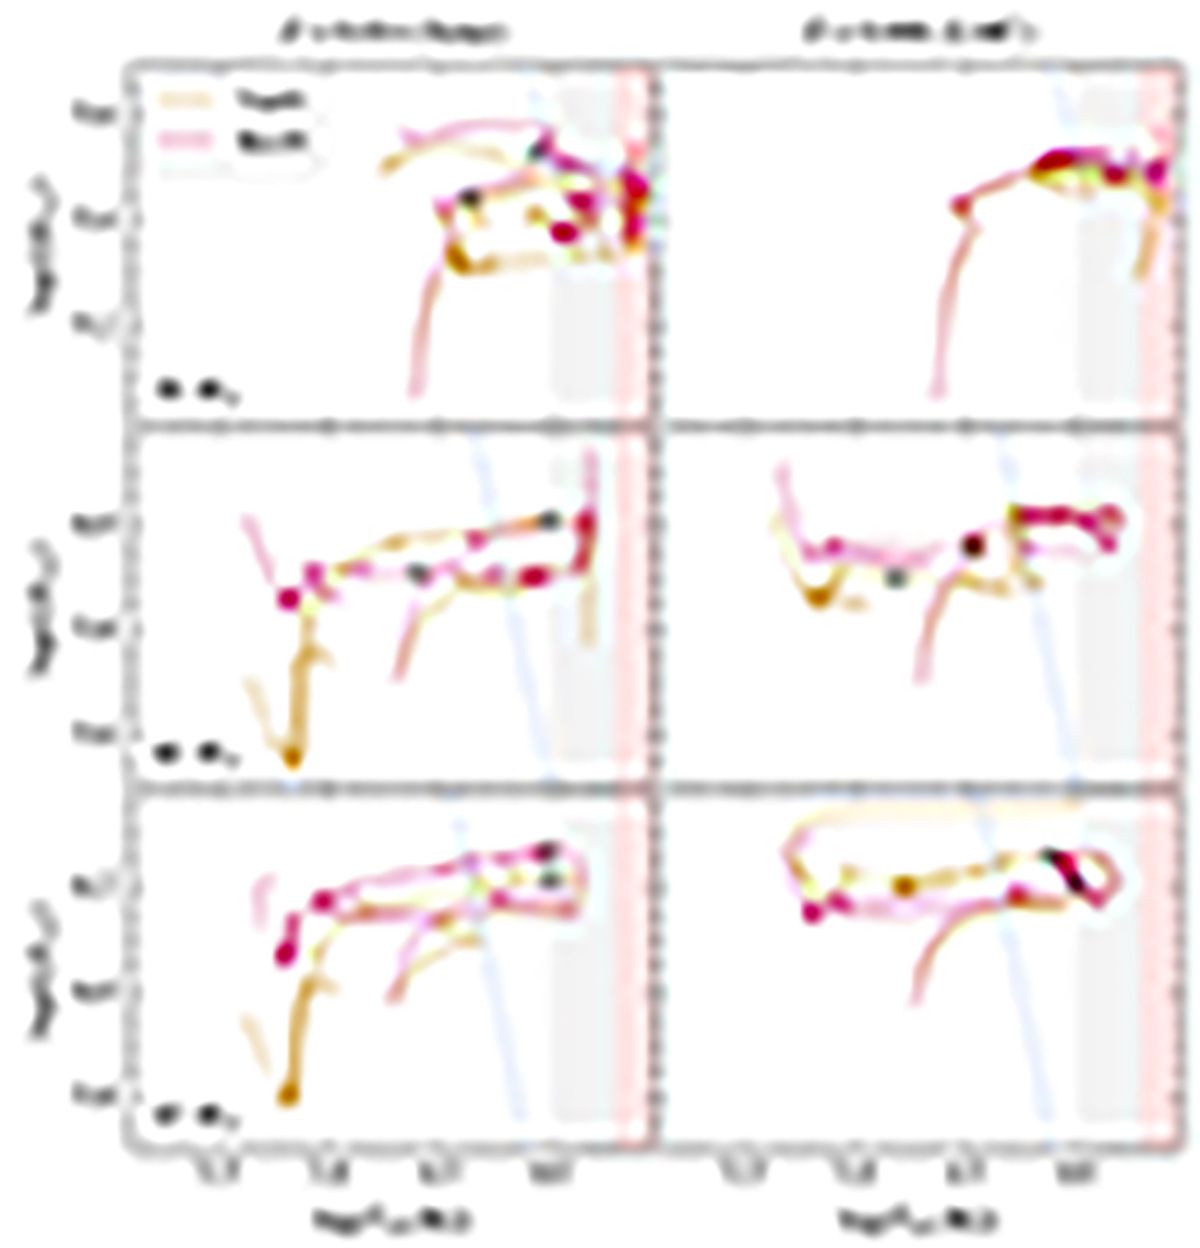
Fig. 7.
Download original image
Evolutionary tracks in the HRD for the 30 M⊙, 60 M⊙, and 85 M⊙ models (from top to bottom) at solar metallicity (left) and LMC metallicity (right). The shaded red area indicates the domain of the RSG phase (log(Teff [K]) < 3.7), and the shaded gray area indicates the domain of the YSG phase (3.7 ≤ log(Teff [K]) < 4.0), as defined in GENEC for the application of specific mass-loss rates. The triangles mark time-steps of 20 000 yr starting from core helium burning. The onset of the WR classification is marked by dotted squares and circles, for models using Vin01 and Bes20, respectively. The blue dashed line indicates the Humphreys–Davidson limit (Davies et al. 2018; Lamers & Fitzpatrick 1988).
Current usage metrics show cumulative count of Article Views (full-text article views including HTML views, PDF and ePub downloads, according to the available data) and Abstracts Views on Vision4Press platform.
Data correspond to usage on the plateform after 2015. The current usage metrics is available 48-96 hours after online publication and is updated daily on week days.
Initial download of the metrics may take a while.