Fig. 5.
Download original image
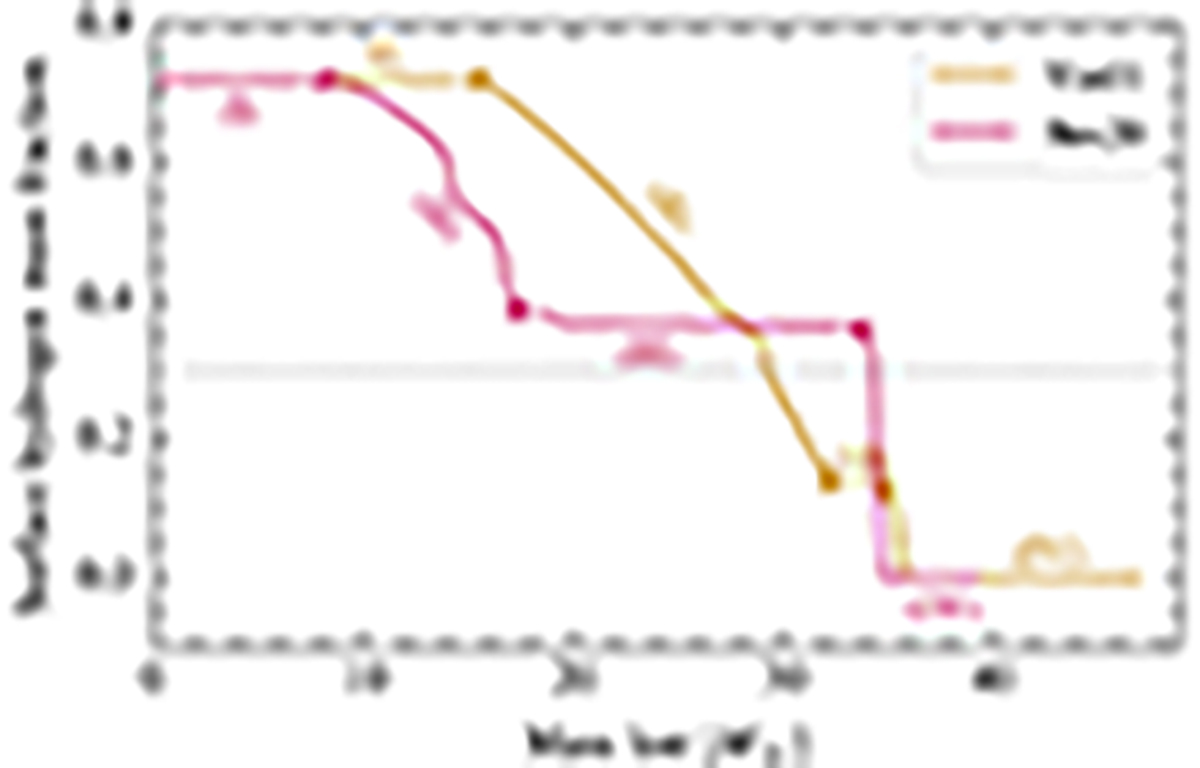
Evolutionary tracks of the 60 M⊙ models at solar metallicity, showing the surface hydrogen mass fraction as a function of current total mass (hydrogen depletion curve). The horizontal line indicates the threshold of surface hydrogen below which a hot star becomes classified as a WR in our models. The “/” markers on the tracks separate the curves into the four characteristic sections (I)–(IV), as explained in the main text.
Current usage metrics show cumulative count of Article Views (full-text article views including HTML views, PDF and ePub downloads, according to the available data) and Abstracts Views on Vision4Press platform.
Data correspond to usage on the plateform after 2015. The current usage metrics is available 48-96 hours after online publication and is updated daily on week days.
Initial download of the metrics may take a while.