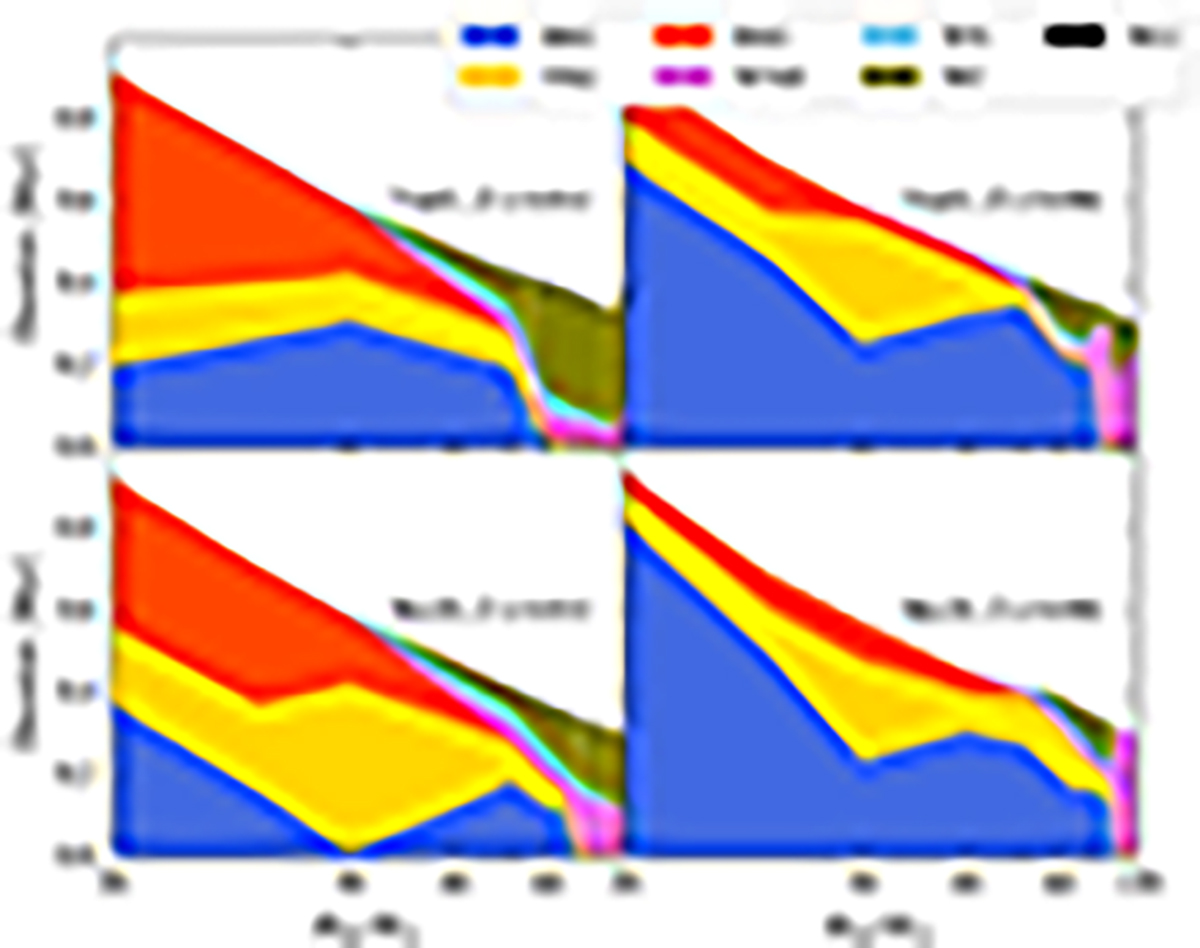
Fig. 12.
Download original image
Duration of the various post-MS phases (colors) for each grid of models using the MS mass-loss prescriptions by Vin01 (top row) and Bes20 (bottom row), at solar metallicity (left column) and LMC metallicity (right column). The dashed white vertical lines represent the approximate location of the break between the low and high MS mass-loss regimes. The durations are shown cumulatively, so there is no information about the order in which the different phases are traversed. Furthermore, the x-axis is a power scale (where ![]() ), designed in such a way that the area of a region corresponding to one phase is proportional to the number of stars currently in that phase, assuming a population of constant star formation rate using the standard initial mass function by Salpeter (1955).
), designed in such a way that the area of a region corresponding to one phase is proportional to the number of stars currently in that phase, assuming a population of constant star formation rate using the standard initial mass function by Salpeter (1955).
Current usage metrics show cumulative count of Article Views (full-text article views including HTML views, PDF and ePub downloads, according to the available data) and Abstracts Views on Vision4Press platform.
Data correspond to usage on the plateform after 2015. The current usage metrics is available 48-96 hours after online publication and is updated daily on week days.
Initial download of the metrics may take a while.