Fig. 11.
Download original image
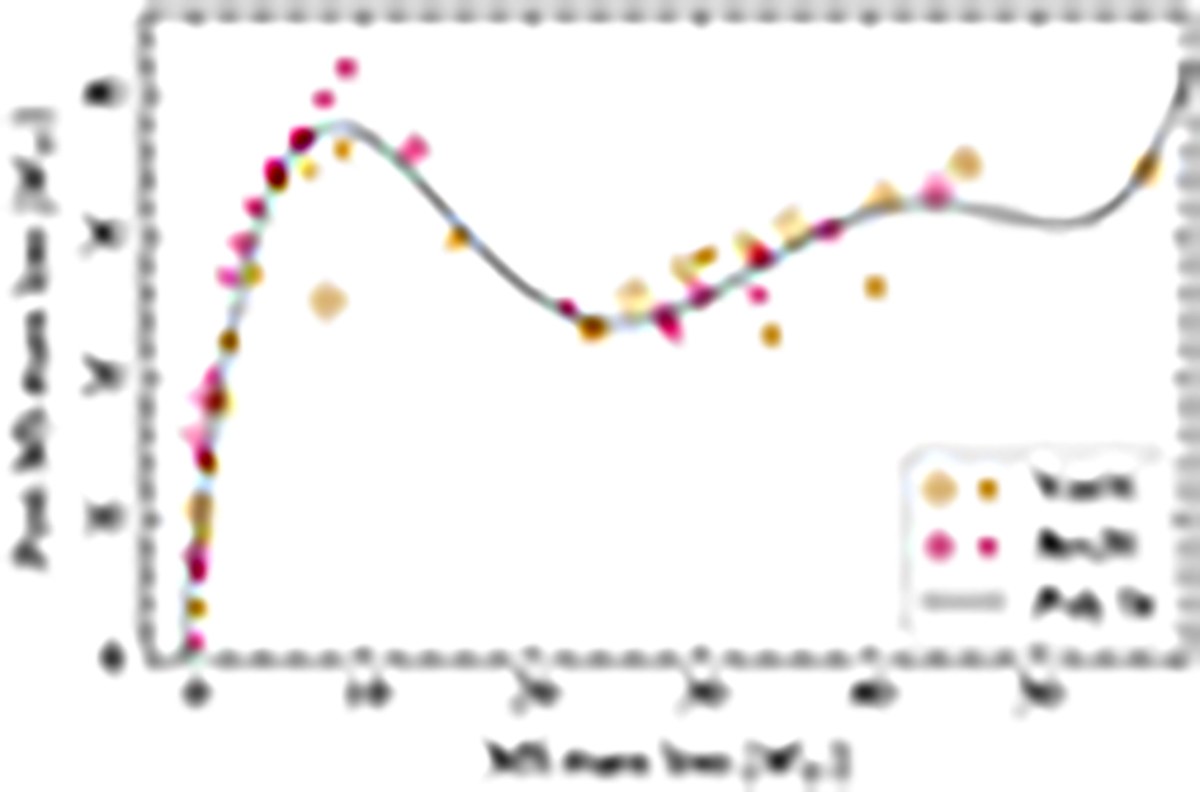
Mass lost after the MS versus during the MS for models at solar metallicity (large markers) and LMC metallicity (small markers). The data are fitted with a n = 5 polynomial fit, which agrees with the data within 21.2% (root mean square relative deviation). Visually, this illustrates that the mass loss experienced during the MS of massive star evolution is a reasonable predictor of the mass loss that will be experienced in the later stages of evolution, regardless of metallicity or MS mass-loss prescription. In particular, the shape of this curve illustrates the “YSG bump” for stars that lose around 10 M⊙ during the MS, which spend the most time in the YSG phase out of all of the models.
Current usage metrics show cumulative count of Article Views (full-text article views including HTML views, PDF and ePub downloads, according to the available data) and Abstracts Views on Vision4Press platform.
Data correspond to usage on the plateform after 2015. The current usage metrics is available 48-96 hours after online publication and is updated daily on week days.
Initial download of the metrics may take a while.