Open Access
Fig. 6
Download original image
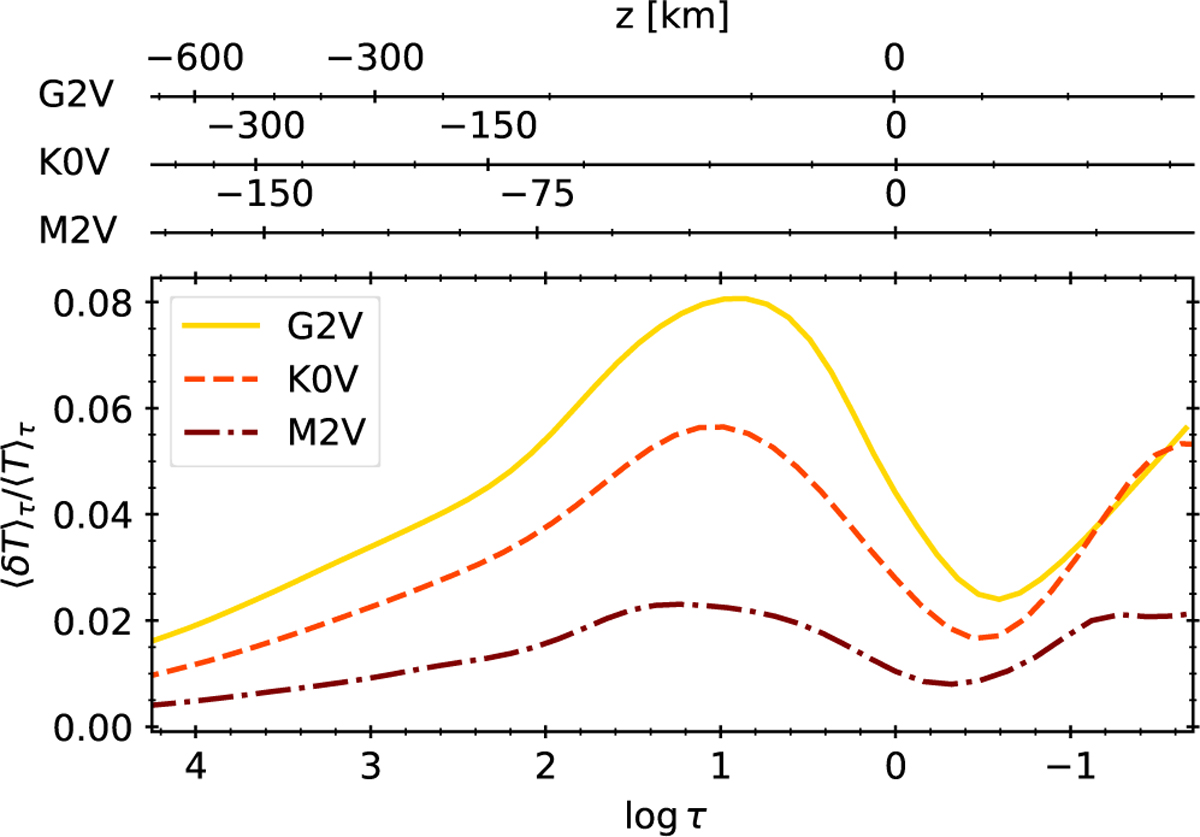
Temperature contrast averaged over Rosseland iso-τ surfaces and time for the three spectral types. The colours and line styles have the same meaning as in Fig. 1. The contrast is computed as the standard deviation of the temperature divided by its mean.
Current usage metrics show cumulative count of Article Views (full-text article views including HTML views, PDF and ePub downloads, according to the available data) and Abstracts Views on Vision4Press platform.
Data correspond to usage on the plateform after 2015. The current usage metrics is available 48-96 hours after online publication and is updated daily on week days.
Initial download of the metrics may take a while.